Design Protocolsresponsive svg backgrounds
Responsive SVG Backgrounds
Why use a responsive background?
A canvas background can be part of the measurement instrument. It might divide a Sociogram into social contexts, show two independent dimensions, or provide regions that give spatial placement a specific meaning.
Ordinary PNG and JPEG images have a fixed shape. Network Canvas shows the whole image without cropping it, so an image designed for a landscape screen will leave empty space when it is shown on a portrait screen.
A responsive SVG behaves differently. Its lines and labels are positioned relative to the available canvas, allowing the layout to expand in both directions. Text remains readable rather than being stretched with the rest of the image.
Use the Background Creator
The Background Creator is a browser-based tool for building responsive SVG backgrounds by drawing, rather than by hand-editing SVG source. It is the recommended way to create a background for the Narrative, Network Composer, and Sociogram interfaces, and it automatically follows every rule described in this article.
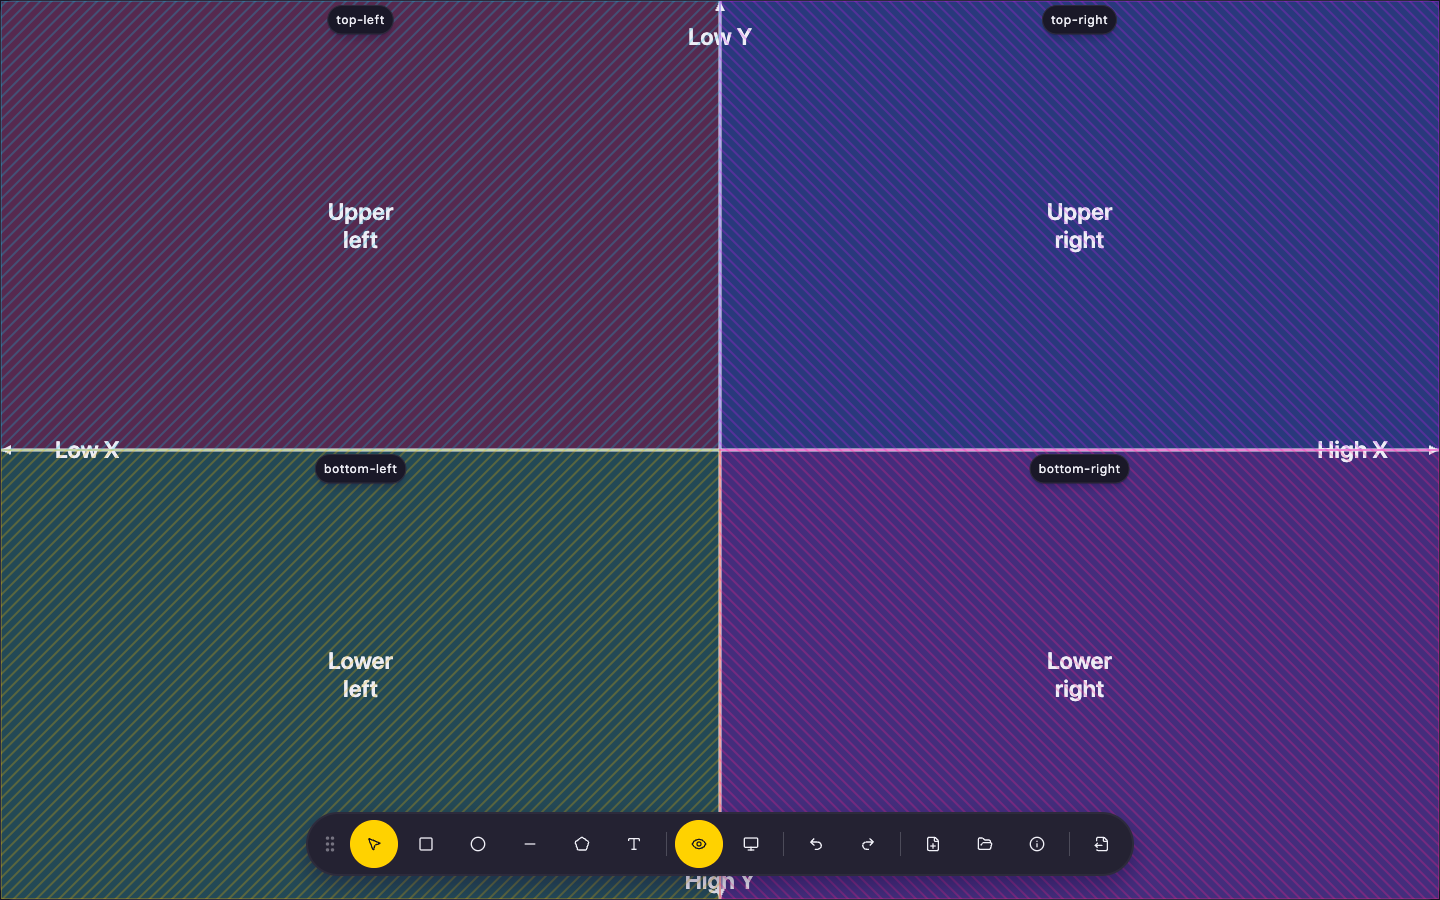
In the Background Creator you can:
- Draw directly on the canvas. Add rectangles, ellipses, lines, polygons, and live text, positioned as percentages so the result is responsive by construction.
- Preview the result in real time. A full-screen preview shows the background exactly as participants will see it, and you can switch between aspect ratios to confirm that lines, fills, and labels still make sense in portrait and landscape.
- Define zones. Mark any rectangle, ellipse, or polygon you draw as a zone and give it a label in its properties. The shape itself is the zone: a visible fill—such as the quadrant fills in the built-in Quadrants template—can double as a zone, or you can leave the shape transparent for a zone that stays invisible to participants. Zone labels become the values of the exported variable.
- Save and reopen your work. Download the finished SVG to add to Architect, or reopen a previously saved SVG to keep editing it.
- Export a ready-to-run Python or R script. The script reads the
_xand_ycolumns from your CSV export (see Classify nodes from their coordinates below) and adds a categorical variable naming the zone each node's position falls in, so you do not have to write your own classification code.
Selecting a shape reveals its properties, where you set its fill, opacity, and stroke, and mark it as a zone. Each zone shows a labelled pill so you can see at a glance which regions will be exported.
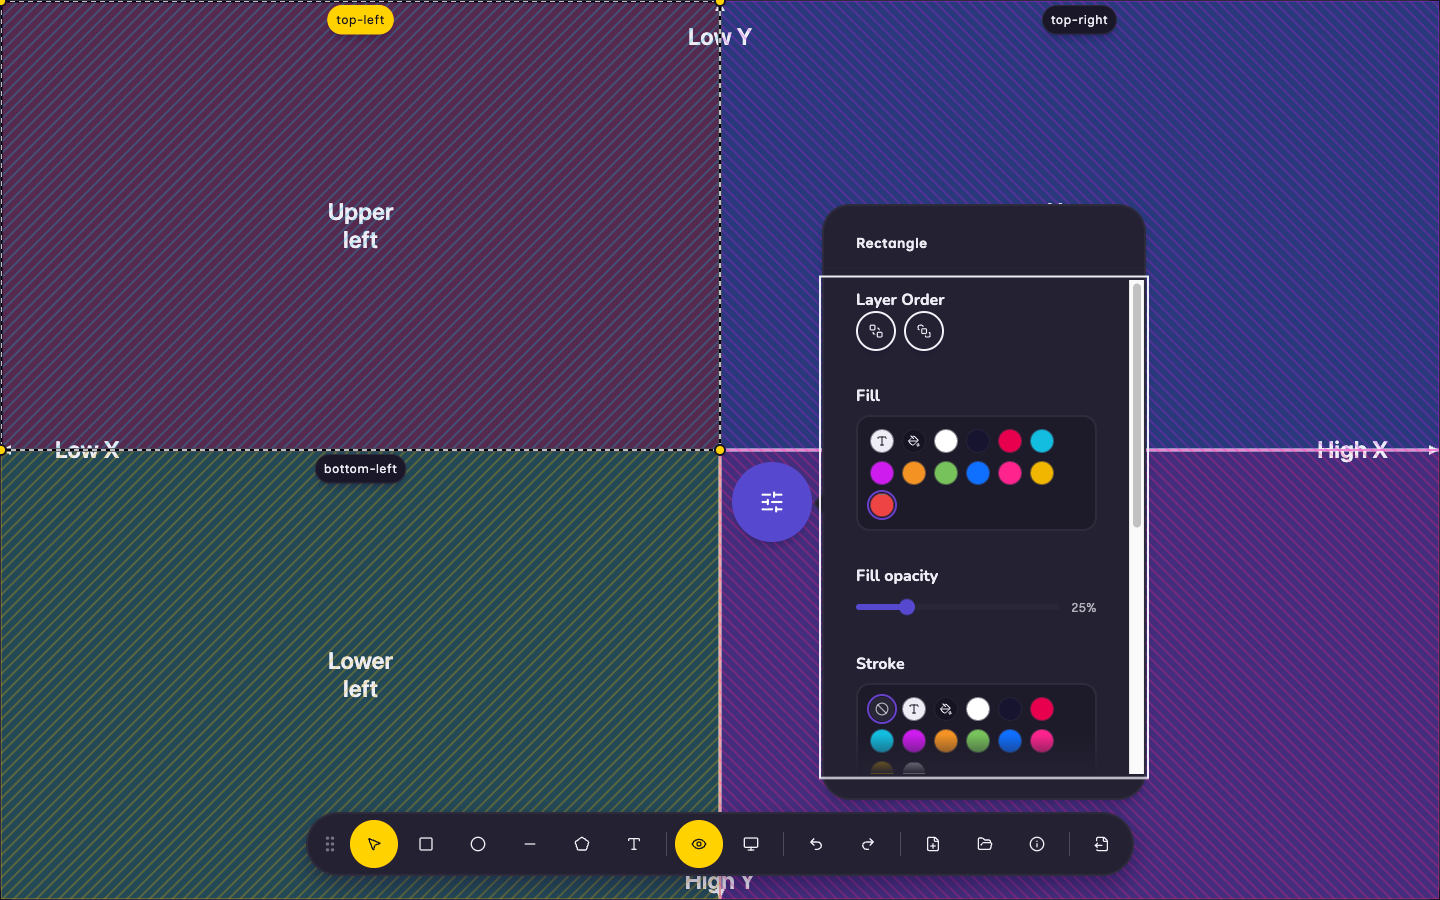
Two built-in templates cover the most common designs: Quadrants, two crossed axes dividing the canvas into four labelled regions like the downloadable template below, and Concentric circles, nested rings for measures where relative closeness to the centre carries categorical meaning (inner, middle, outer). Both templates already include matching zones, ready to export.
If you would rather work in a graphics editor, or only need to reword the built-in quadrant template, Adobe Illustrator and Inkscape below describe those manual alternatives.
Is a responsive SVG appropriate for your measure?
Responsive backgrounds are most appropriate when horizontal and vertical positions represent separate dimensions, or when regions should always extend to the edges of the canvas.
| Research design | Recommended approach |
|---|---|
| Two independent axes, quadrants, categories, or social contexts | Use a responsive SVG |
| Relative horizontal and vertical positions will be analyzed independently | Use a responsive SVG |
| Euclidean distance, angle, or the shape of a circle has substantive meaning | Use a contained image or keep devices in one orientation |
| A photograph, map, anatomical diagram, or other image must not be distorted | Use a contained image |
This distinction matters analytically. A responsive background preserves each position as a proportion of the horizontal and vertical space, but it does not preserve angles or distances when the screen changes shape. For example, concentric circles would become ellipses in portrait mode and should therefore remain a contained image.
Good to know:
In portrait or landscape, the Background Creator's built-in Concentric circles template stretches its rings into ellipses—and because each ring is itself the zone, membership stretches identically, so each node is still assigned the ring the participant actually saw. Hold Shift while drawing a ring to make it perfectly round at the aspect ratio you are currently previewing, so you can choose which screen shape you optimize for. If your measure instead depends on precise Euclidean distance or an undistorted circle, use a contained image instead, following the guidance above.
Start with the template
If you are not using the Background Creator, you do not need to create an SVG from scratch by hand either. The manual alternative is to download this template and replace its four labels with terms from your own study.

The template uses a contextual name-generator example. Bidart and Charbonneau describe a contextual name generator for building a broad view of someone's network from the social contexts of everyday life.
The four example areas—Family, Friends, Work or study, and Community—are only illustrative. Contexts are not necessarily exhaustive or mutually exclusive. A person may be both a friend and a coworker, so your prompt should explain how participants should handle overlaps.
Adapt the template for your study
1. Plan the spatial task
Before editing the image, write down what placement in each region will mean. Keep labels short and use the same terms in the stage instructions. Consider:
- whether regions overlap conceptually;
- whether participants can use an “other” or “unsure” area;
- whether placement within a region has additional meaning;
- how nodes placed near a boundary should be interpreted; and
- whether the resulting positions will be analyzed as categories, coordinates, or both.
2. Download and copy the template
Download the template above and keep the original unchanged. Make a copy with a
descriptive name such as support-contexts.svg.
The .svg ending is important. It tells Architect and the operating system that
the file is an SVG image.
3. Change the labels
An SVG is an image, but its labels are stored as ordinary words inside the file. You can change them with a plain-text editor:
- Windows: Notepad
- macOS: TextEdit, after choosing Format → Make Plain Text
- Linux: a plain-text editor such as Gedit or Kate
Open the copied SVG. It will look unfamiliar because you are seeing the instructions used to draw the image. You only need to use Find and Replace to change these visible terms:
| Find | Replace with |
|---|---|
Family | Your first context |
Friends | Your second context |
Work or | The first line of your third context |
study | The second line of your third context |
Community | Your fourth context |
Do not change punctuation or symbols such as <, >, ", /, =, or %.
Save the file as plain text using UTF-8 encoding, and make sure its name still
ends in .svg rather than .svg.txt.
Take Care!
Do not edit the SVG in Microsoft Word, Apple Pages, Google Docs, or another word processor. These applications add document formatting that will stop the file from working as an image.
4. Add the background in Architect
- Open the Narrative, Network Composer, or Sociogram stage that will use the background.
- In the Background section, choose Image.
- Browse for your edited
.svgfile, or select it from the resource library if you have already added it. - Write stage instructions that explain the meaning of the regions or axes. The background should reinforce those instructions, not replace them.
- Open Preview Mode and inspect the stage in portrait and landscape orientations.
Classify nodes from their coordinates
If you built your background in the Background
Creator and defined zones there, you do not need
to write the classification logic below by hand: export a Python or R script
and it will assign each node's zone for you from the layout variable's _x
and _y columns. The rest of this section explains the underlying coordinate
system, and shows how to write that classification yourself for a background
built without zones.
When a participant positions a node, Network Canvas stores the center of that node as two normalized coordinates in the prompt's layout variable:
x = 0is the left edge andx = 1is the right edge.y = 0is the top edge andy = 1is the bottom edge.
The downward direction of the y-axis is worth noting because it is the opposite of a conventional Cartesian graph.
When exporting data, leave Use screen layout coordinates disabled. The normalized values are device-independent and correspond directly to the percentage positions used by a responsive SVG. See Data Export for more about this option.
In a CSV export, a layout variable called box_layout produces columns called
box_layout_x and box_layout_y. Nodes that were not placed have missing
values. GraphML exports contain the equivalent _X and _Y values.
Apply the template's quadrant rules
The template divides the canvas at 50% in both directions. This is equivalent to
cutting the normalized coordinates at 0.5.
| Quadrant | Template label | Coordinate rule |
|---|---|---|
| Upper-left | Family | x < 0.5 and y < 0.5 |
| Upper-right | Friends | x > 0.5 and y < 0.5 |
| Lower-left | Work or study | x < 0.5 and y > 0.5 |
| Lower-right | Community | x > 0.5 and y > 0.5 |
For example, a node at (0.25, 0.33) is in the upper-left quadrant. A node at
(0.75, 0.67) is in the lower-right quadrant.
Decide how to treat boundaries
A node can be centered exactly on an axis or close enough that its visual area overlaps two regions. Specify this case before analysis rather than assigning it silently.
One approach is to define a boundary tolerance. A tolerance of 0.02 classifies
any node within two percentage points of either axis as Boundary:
Choose R or Python below to see how to create a context column from the
exported coordinates. The R example is shown by default.
boundary_tolerance <- 0.02

alters |>
  dplyr::mutate(
    context = dplyr::case_when(
      is.na(box_layout_x) | is.na(box_layout_y) ~ NA_character_,
      abs(box_layout_x - 0.5) <= boundary_tolerance |
        abs(box_layout_y - 0.5) <= boundary_tolerance ~ "Boundary",
      box_layout_x < 0.5 & box_layout_y < 0.5 ~ "Family",
      box_layout_x > 0.5 & box_layout_y < 0.5 ~ "Friends",
      box_layout_x < 0.5 & box_layout_y > 0.5 ~ "Work or study",
      box_layout_x > 0.5 & box_layout_y > 0.5 ~ "Community"
    )
  )