desktop 🠖 interface documentation
Sociogram
Type:
Name Interpreter and Edge Generator
Creates:
Edges of multiple types, and attribute data on a single node type
Uses Prompts:
true
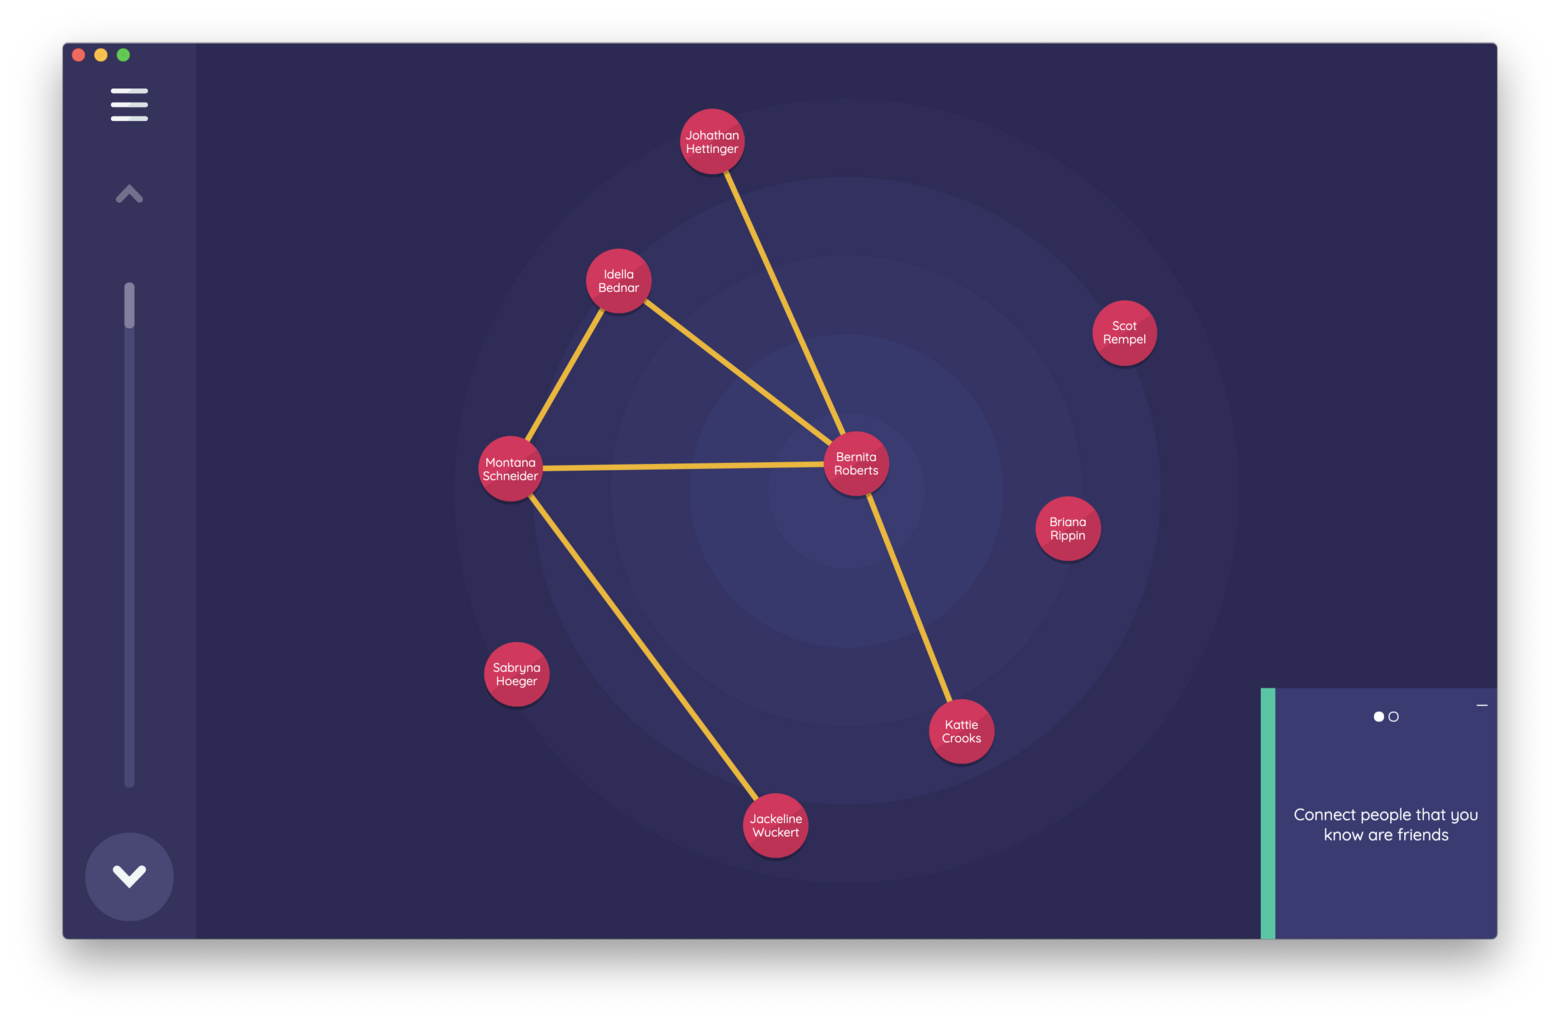
Sociograms are the visual mapping component of a network interview. On the Sociogram, participants draw ties between alters to signify the relationships between individuals within their personal network.
There are two sociogram Interfaces in Network Canvas - one for data collection and one for data display - that can be added to your study and configured in Architect.
Sociogram
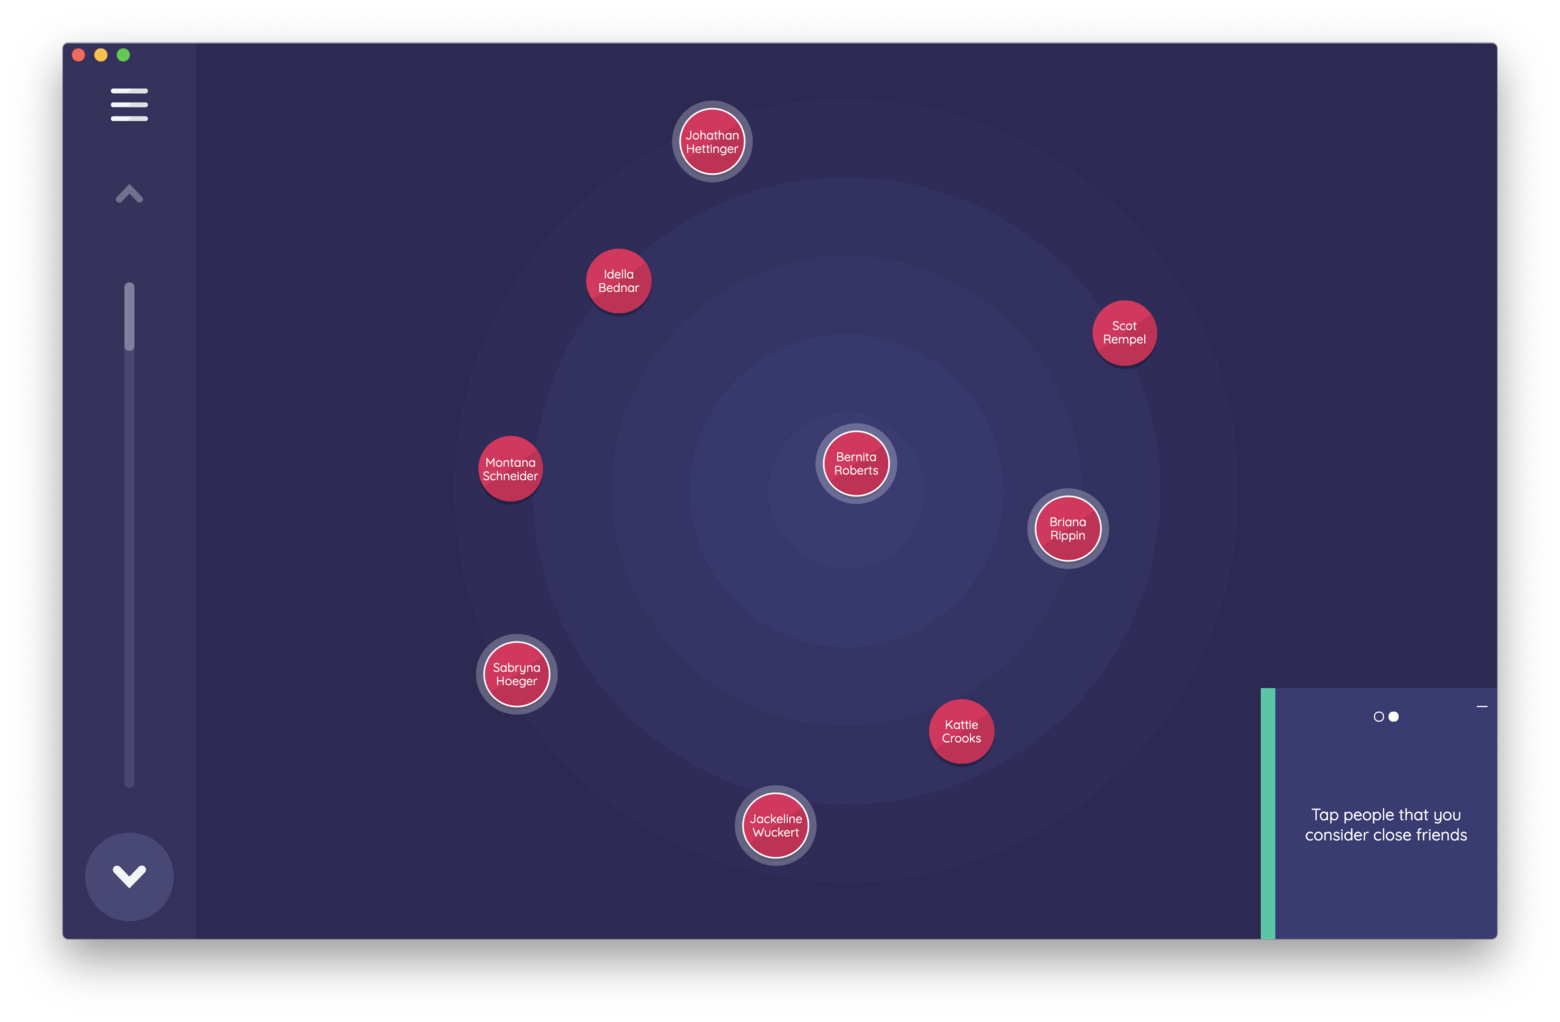
When using the "Sociogram" Interface, participants position their alters and draw ties between them. The Interface can be used to create one or multiple edge types between alters in a participant's network, and to collect alter attribute data by highlighting alters where the variable value is true.
Best Practices
Consider customizing the background image of the sociogram to orient participants to the activity or to add meaning to the layout variable (e.g. such as using quadrants).
Ensure that the prompts used on this Interface are edge creation prompts - questions about the relationships between alters.
Try to Avoid
Nodes positioned too close together may visually occlude one another or the edge between them. Caution participants not to place nodes directly on top of one another.