Design Protocolsinterface documentation
Sociogram
- Type
- Name Interpreter and Edge Generator
- Creates
- Edges of multiple types, and attribute data on a single node type
- Uses Prompts
- Yes
- Schema
- v1+
- Available In
- Architect ClassicArchitectInterviewer ClassicInterviewerFresco
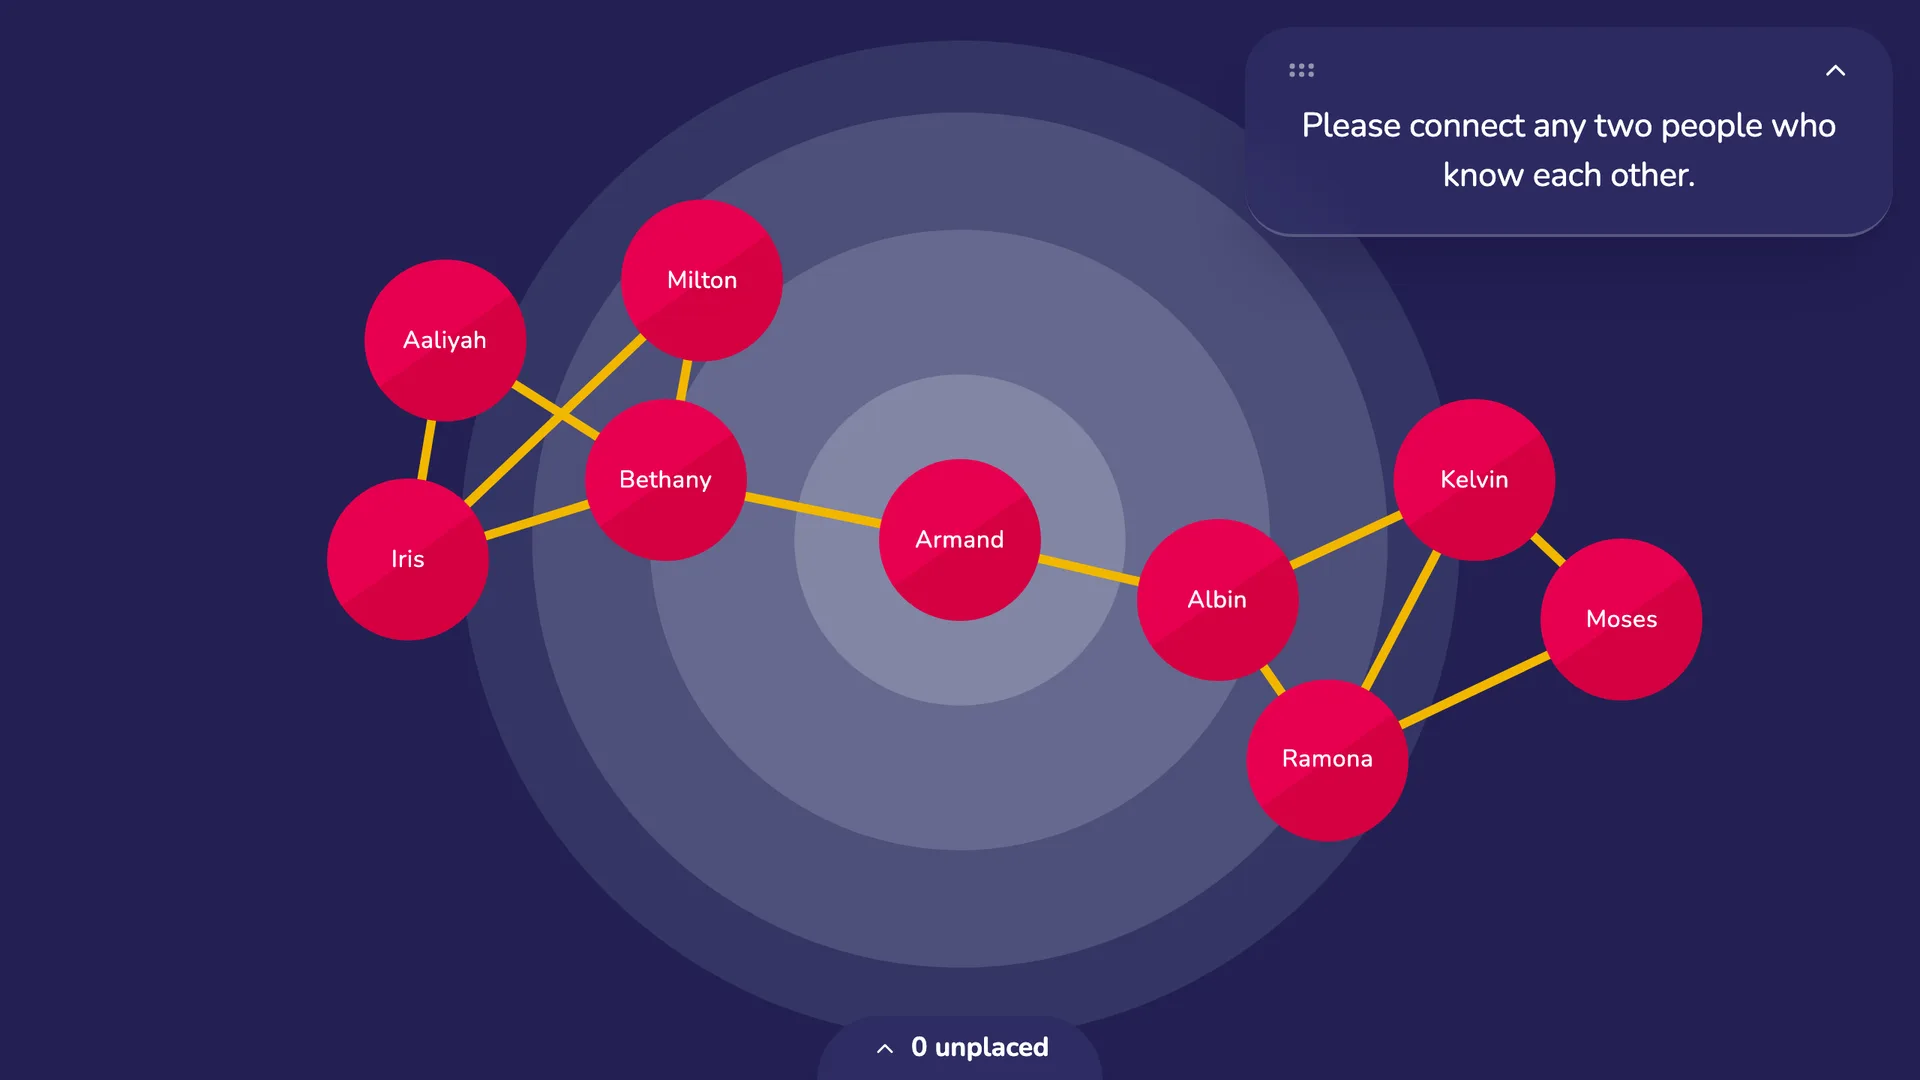
The Sociogram and the Narrative are Network Canvas's two canvas-based visualization interfaces. On the Sociogram, participants build the spatial picture of their network — positioning alters on a canvas and drawing the ties between them. The Narrative is its display-only companion: it replays a network the participant has already laid out for open, researcher-led discussion, without collecting new data.
When using the Sociogram, participants position their alters and draw ties between them. The interface can create one or more edge types between alters, and can collect boolean attribute data by highlighting alters where a variable's value is true.
Configuring
A Sociogram is built from one or more prompts. Each prompt sets a task on the canvas — placing nodes, drawing a particular kind of tie, or marking an attribute — and the participant moves through the prompts in turn. A few settings are shared by the whole stage (the background and the positioning mode); the rest are configured per prompt.
The layout variable
Every prompt has a layout variable, which stores each node's position on the canvas as a pair of coordinates. This is where the spatial data you collect on the Sociogram is recorded.
If you use the same layout variable across all of a stage's prompts, a node's position carries over as the participant moves between tasks, so they refine one shared arrangement. If you want separate spatial measures, give each prompt a different layout variable — reusing a variable replaces the earlier coordinates. Positions are stored as normalized coordinates that a responsive SVG background can turn into meaningful regions during analysis.
Automatic or manual positioning
A stage-level Layout Mode setting decides how nodes first reach the canvas:
- Manual places every node in a bucket at the edge of the screen. The participant drags each node onto the canvas to position it, and can drag a node back to the bucket to remove it. You can sort the bucket so nodes are offered in a set order.
- Automatic positions the nodes for the participant with a force-directed layout that simulates attraction and repulsion when the stage opens. The participant can pause and resume the simulation during the interview, and adjust individual positions while it is paused.
Background
A Sociogram stage can sit on either a series of concentric circles or a custom background image. For the concentric-circles background you choose how many circles to draw, and can optionally skew them so the middle rings are proportionally larger. For an image background, a responsive SVG works best because it keeps regions and labels readable as the canvas changes shape between portrait and landscape — see Responsive SVG Backgrounds.
Consider customizing the background to orient participants to the activity or to give the layout meaning — for example dividing the canvas into quadrants or social contexts that node positions can then be read against.
Creating and displaying edges
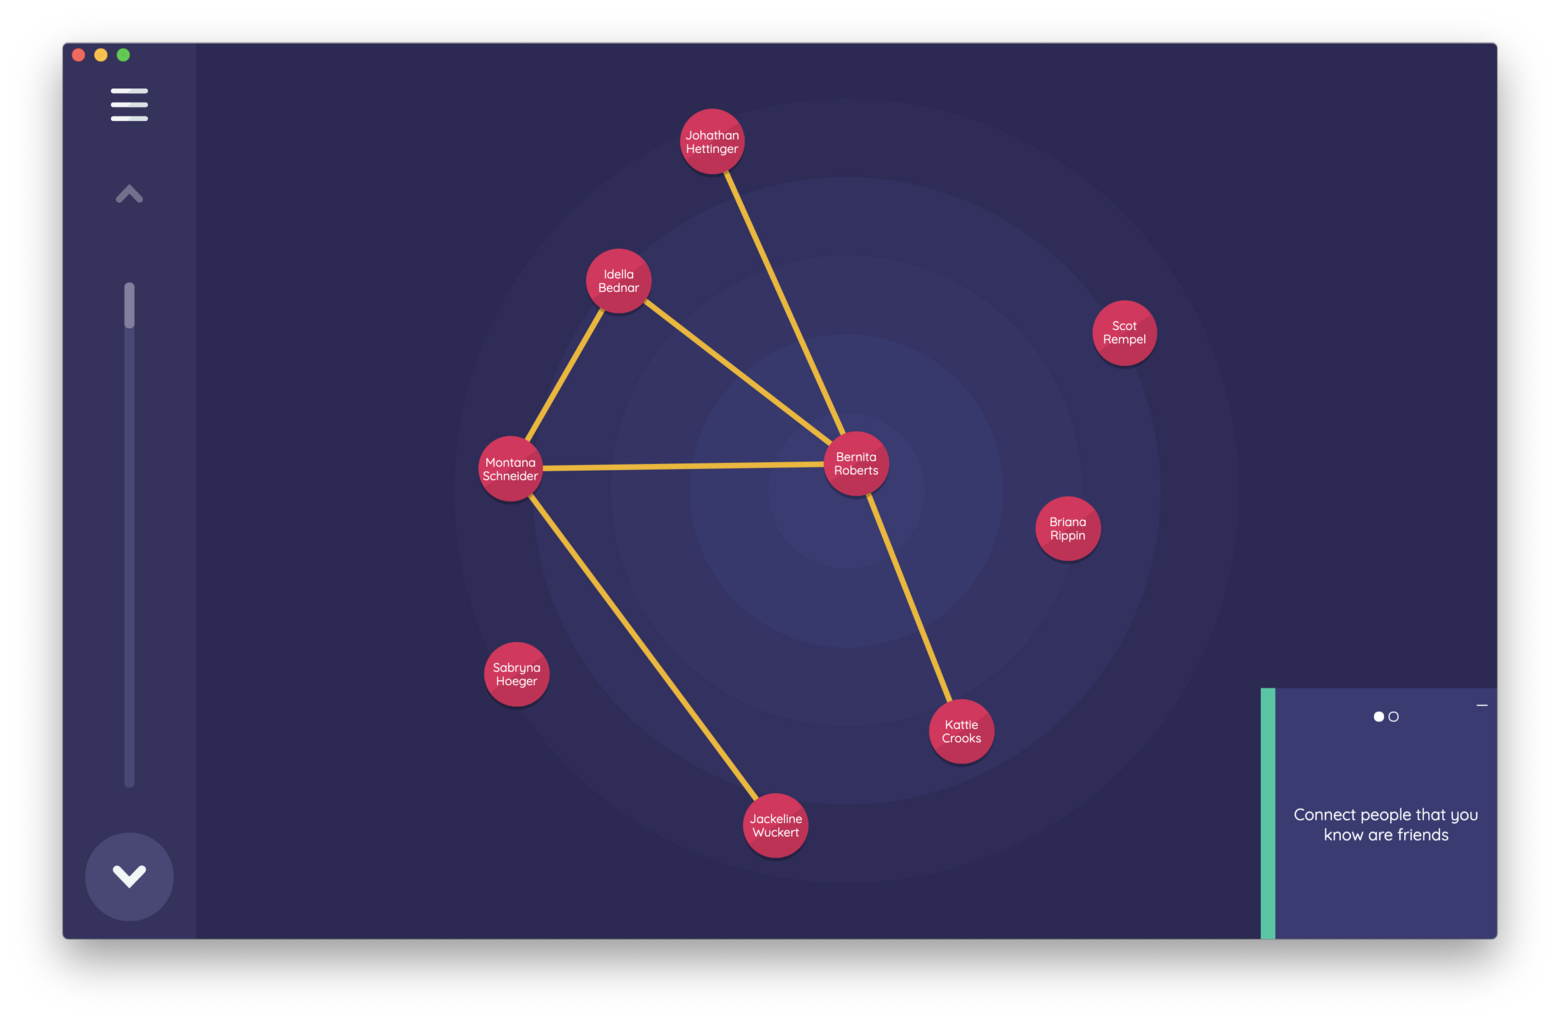
Tapping a node can let the participant draw ties. On a prompt configured for edge creation, tapping one node and then another creates an edge of the chosen type between them; tapping the pair again removes it. Each edge-creation prompt creates a single edge type, so use a separate prompt for each kind of relationship you want to collect.
Independently, a prompt can display one or more edge types, which is useful for showing ties the participant drew on an earlier prompt while they work on a new task. The edge type a prompt creates is always displayed on that prompt. Where two nodes are connected by more than one displayed edge type, only one of those edges is drawn.
Highlighting attributes
Instead of drawing edges, a prompt can use tapping to toggle an attribute. Tapping a node switches a boolean variable between true and false, and nodes whose value is true are highlighted. This lets you collect a yes/no attribute — such as whether each alter belongs to a group or has a particular characteristic — directly on the canvas.
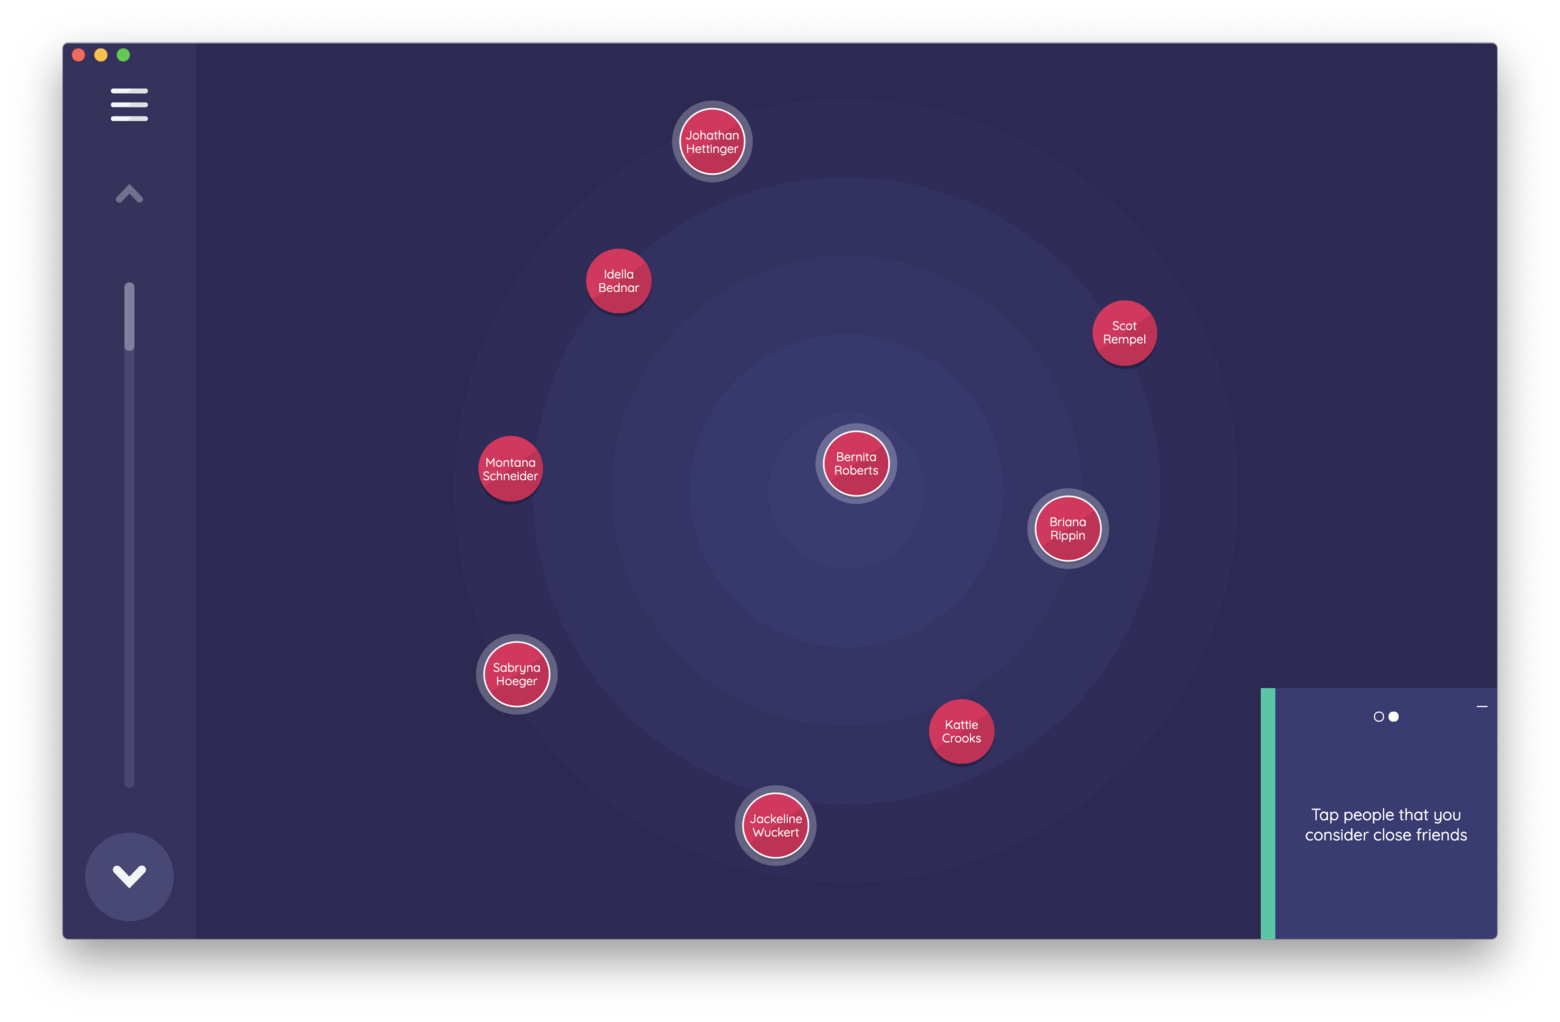
Edge creation and attribute toggling are the two tap behaviors, and a single prompt uses one or the other — not both. Split the two tasks across separate prompts when you need each.
Best Practices
Keep the same layout variable across a stage's prompts when you want participants to build up one arrangement of their network, so the positions they set on an early prompt are still there on later ones.
Match each prompt's wording to its tap behavior: ask about relationships on edge-creation prompts, and about a characteristic of individual alters on attribute-toggling prompts.
Try to Avoid
Nodes positioned too close together may visually occlude one another, or the edge between them. Caution participants not to place nodes directly on top of one another.