Design Protocolstutorials
Implementing CEGRM
Summary:
This tutorial shows how to implement the Colored Eco-Genetic Relationship Map (CEGRM) method in Network Canvas. The bundled CEGRM template combines a genetic pedigree, a personal support network, family health communication roles, and a qualitative mapping interview in one protocol. Each remains a distinct construct in the resulting data.
Prerequisites:
Before adapting the template, you should:
- Be familiar with personal network research and the distinction between node, edge, and participant-level data.
- Understand the clinical or public-health context of the inherited condition you are studying.
- Have access to Architect.
- Read the foundational CEGRM papers, especially Kenen and Peters (2001) and Peters et al. (2006).
- Have an approved plan for consent, third-party family information, distress, referral, and any disclosure of genetic risk.
Duration:
60 minutes
What CEGRM is designed to do
The CEGRM was developed to represent an inherited condition inside the social world through which people understand it, respond to it, and communicate about it. Its foundational account describes a hybrid of the genetic pedigree, the family-systems genogram, the ecomap, and social network analysis. The method places biological kin, relatives by marriage or social relationship, and non-kin on a common visual field, then marks the people involved in different forms of social exchange (Kenen and Peters, 2001).
The two source traditions answer different questions. A pedigree shows plausible routes of biological inheritance. It does not show who shares information, gives practical help, or provides emotional support. Personal network methods can record those relationships, but usually omit the reproductive and multi-generational structure needed to study an inherited condition. CEGRM retains both structures in the same map.
Published CEGRMs were co-constructed by an investigator and participant during a semi-structured interview. Later work treats the map and the interview as interconnected data sources. One Li-Fraumeni syndrome study reports average interview durations of 30–45 minutes (Peters et al., 2016). The participant's account of an apparent gap, cluster, or difficult relationship can be as informative as the diagram itself.
Good to know:
Use Network Canvas as an interviewer-assisted visual elicitation protocol. The interface structures the task and preserves the network data; the interviewer remains responsible for pacing, probing, and ethical judgement.
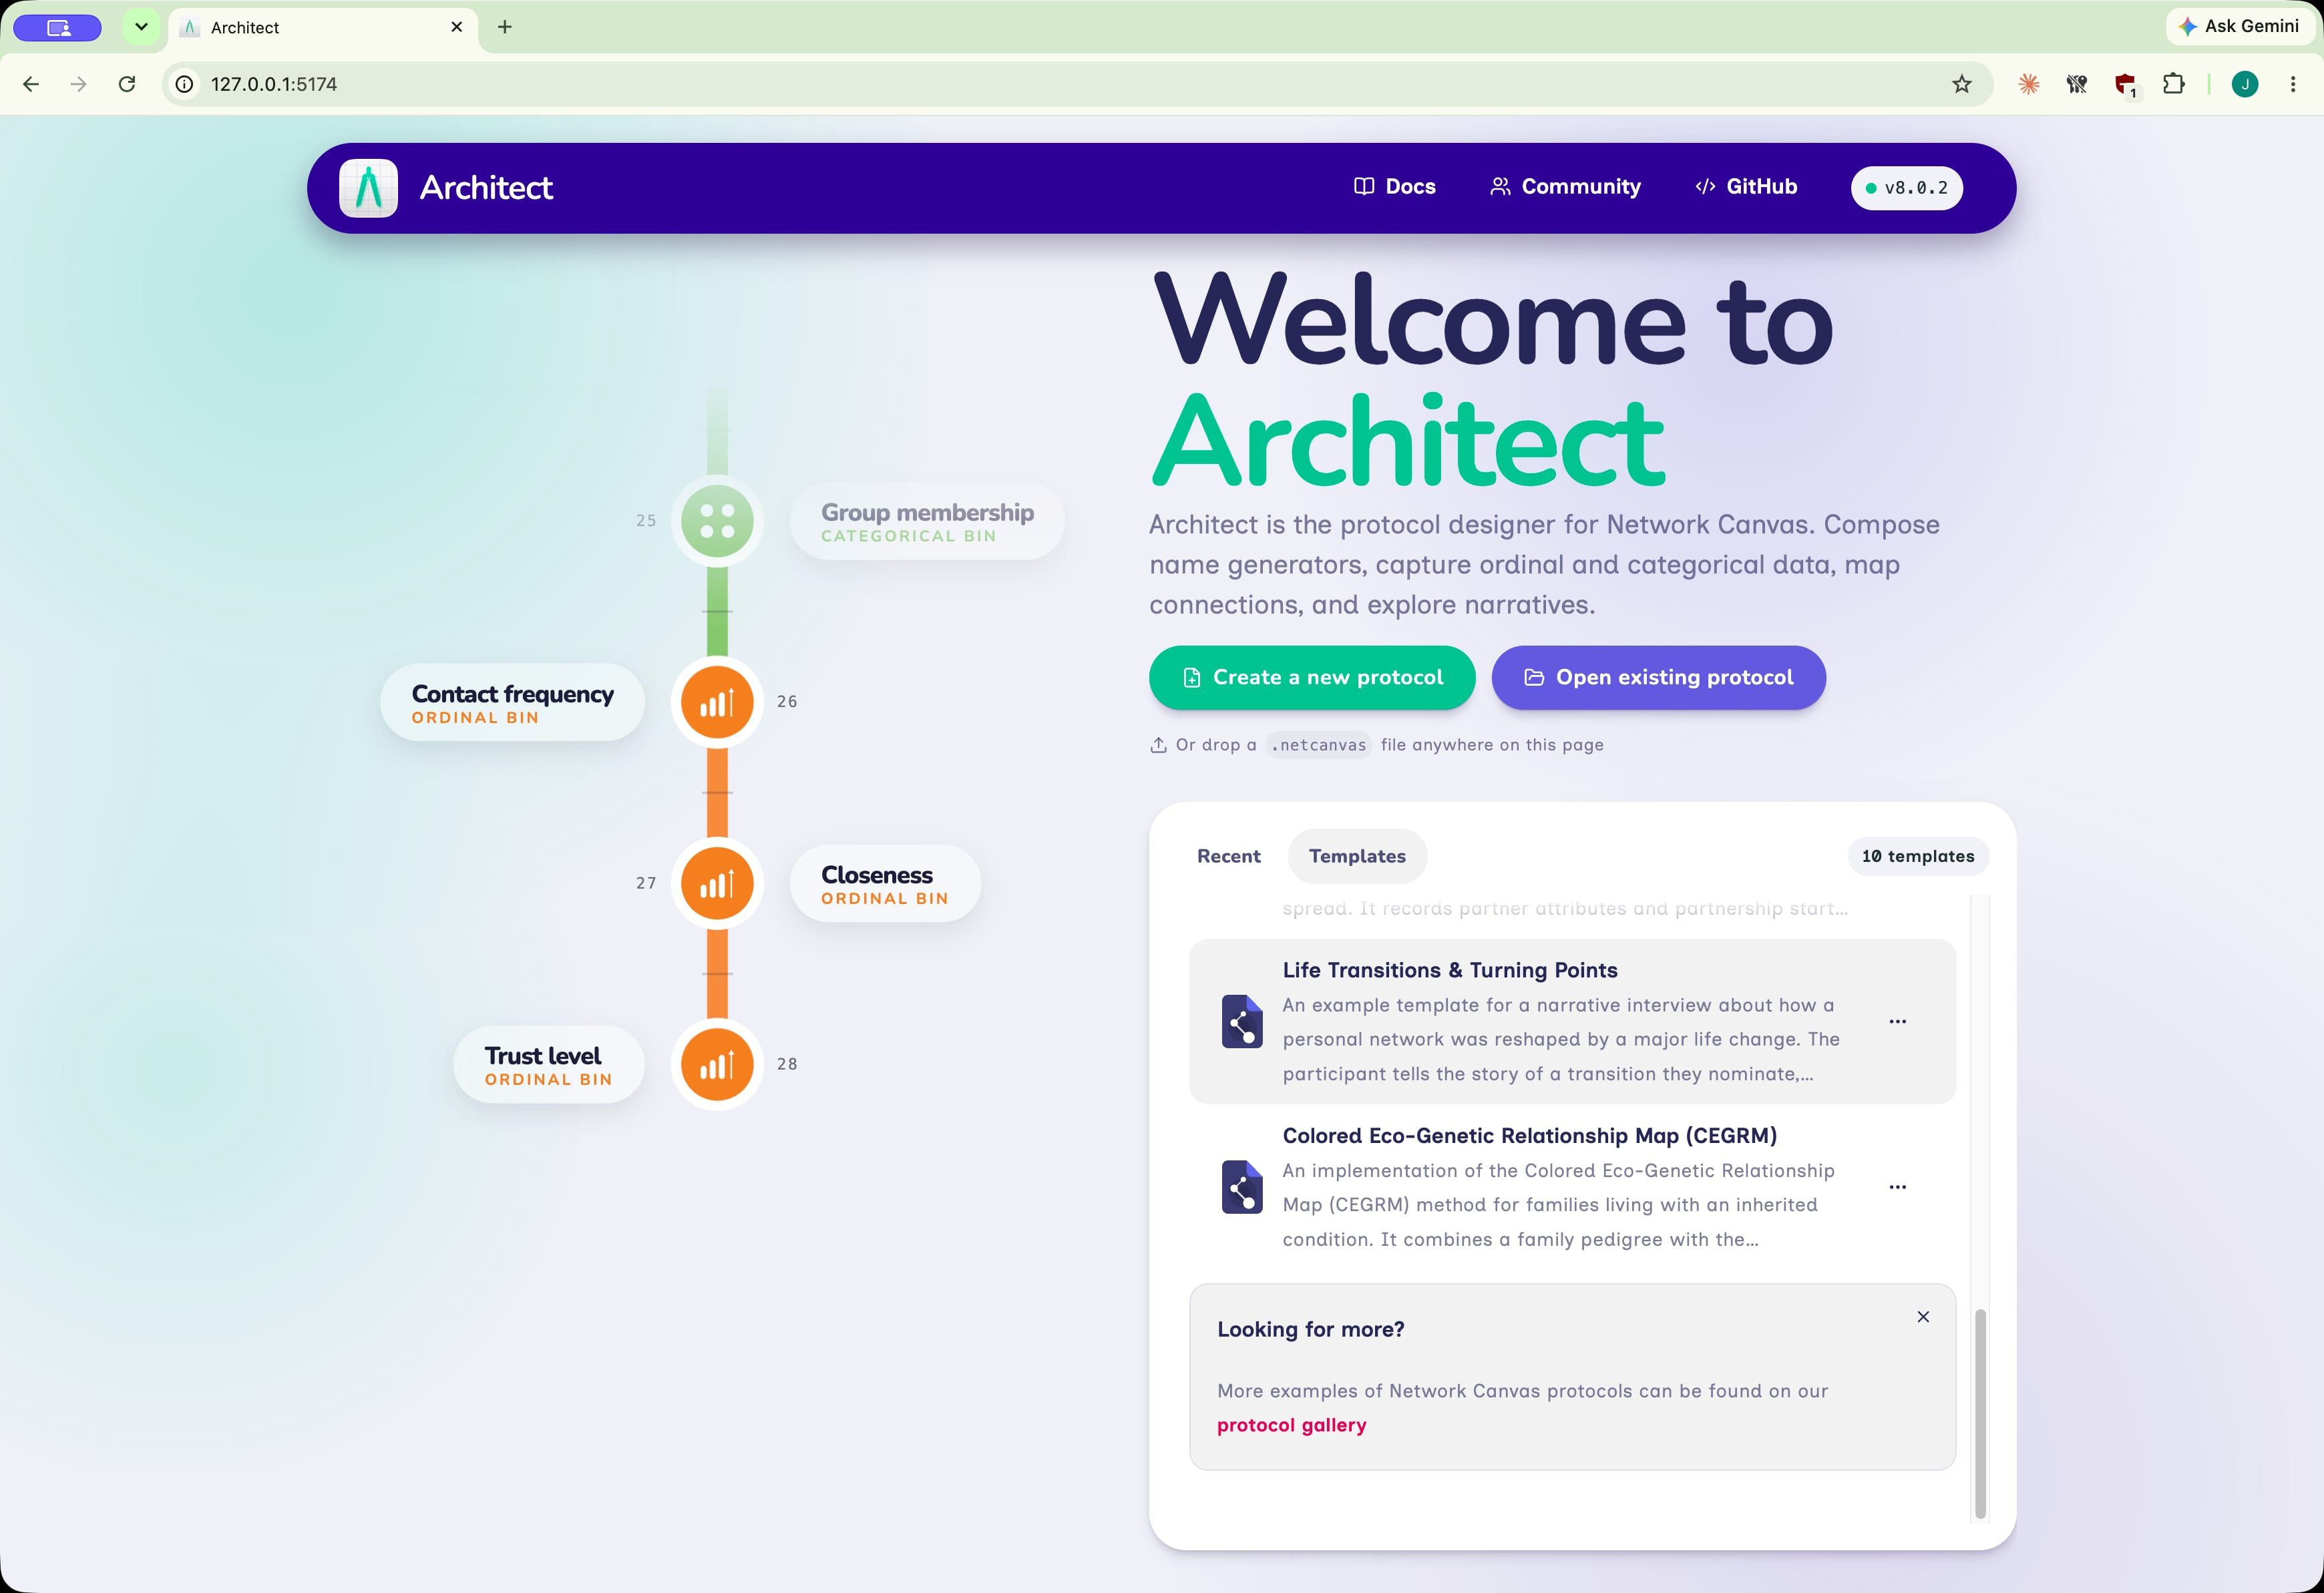
Start from the CEGRM template
Open Architect and select the Templates tab. Choose Colored Eco-Genetic Relationship Map (CEGRM) and give your copy a study-specific name. Architect creates an editable copy; the bundled template itself remains unchanged.
The first stage is a researcher-facing note that summarizes the instrument, lists the decisions that must be made before fieldwork, and links to the core literature. Delete that stage before deployment, but only after transferring its instructions into your study documentation and interviewer training materials.
The template is a methodological starting point. It is not a clinical instrument that can be fielded unchanged. Its consent text is illustrative, every reference to "this condition" must be replaced, and the inheritance display uses conservative defaults. The research team remains responsible for condition-specific validity and for the required ethical and clinical review.
The protocol as a methodological translation
Network Canvas represents a CEGRM as one interview with 14 stages. The order follows the data dependencies in the protocol. Each stage writes a bounded part of the record; later stages interpret or extend what is already present.
| Stage | Interface | Methodological purpose |
|---|---|---|
| 1. Template notes | Information | Researcher instructions and sources; remove before fielding. |
| 2. Welcome and consent | Ego Form | Explain the mapping task, its sensitive content, and participation choice. |
| 3. About you | Ego Form | Collect the participant attributes needed by the study. |
| 4. Family pedigree | Family Pedigree | Co-construct the multi-generational family and nominate condition and testing status. |
| 5. Beyond the family | Information | Mark the transition from pedigree construction to the wider social environment. |
| 6. People in your life | Name Generator (quick add) | Add friends, colleagues, group members, and health professionals to the same person node type. |
| 7. How you know each person | Categorical Bin | Classify non-family contacts without overwriting pedigree-derived kinship. |
| 8. How close you feel | Ordinal Bin | Add perceived closeness for all people except the participant. |
| 9. How often you are in contact | Ordinal Bin | Add current contact frequency, excluding people recorded as deceased. |
| 10. Exchanges of support | Sociogram | Record who knows whom and the four CEGRM support domains. |
| 11. Talking about the condition | Sociogram | Identify family information gatherers, disseminators, and blockers. |
| 12. The completed map | Narrative | Compare support and communication overlays on one stable layout and elicit interpretation. |
| 13. How the condition runs in the family | Narrative Pedigree | Revisit disease incidence in its multi-generational family structure. |
| 14. Closing | Information | Debrief and connect the participant with the approved support pathway. |
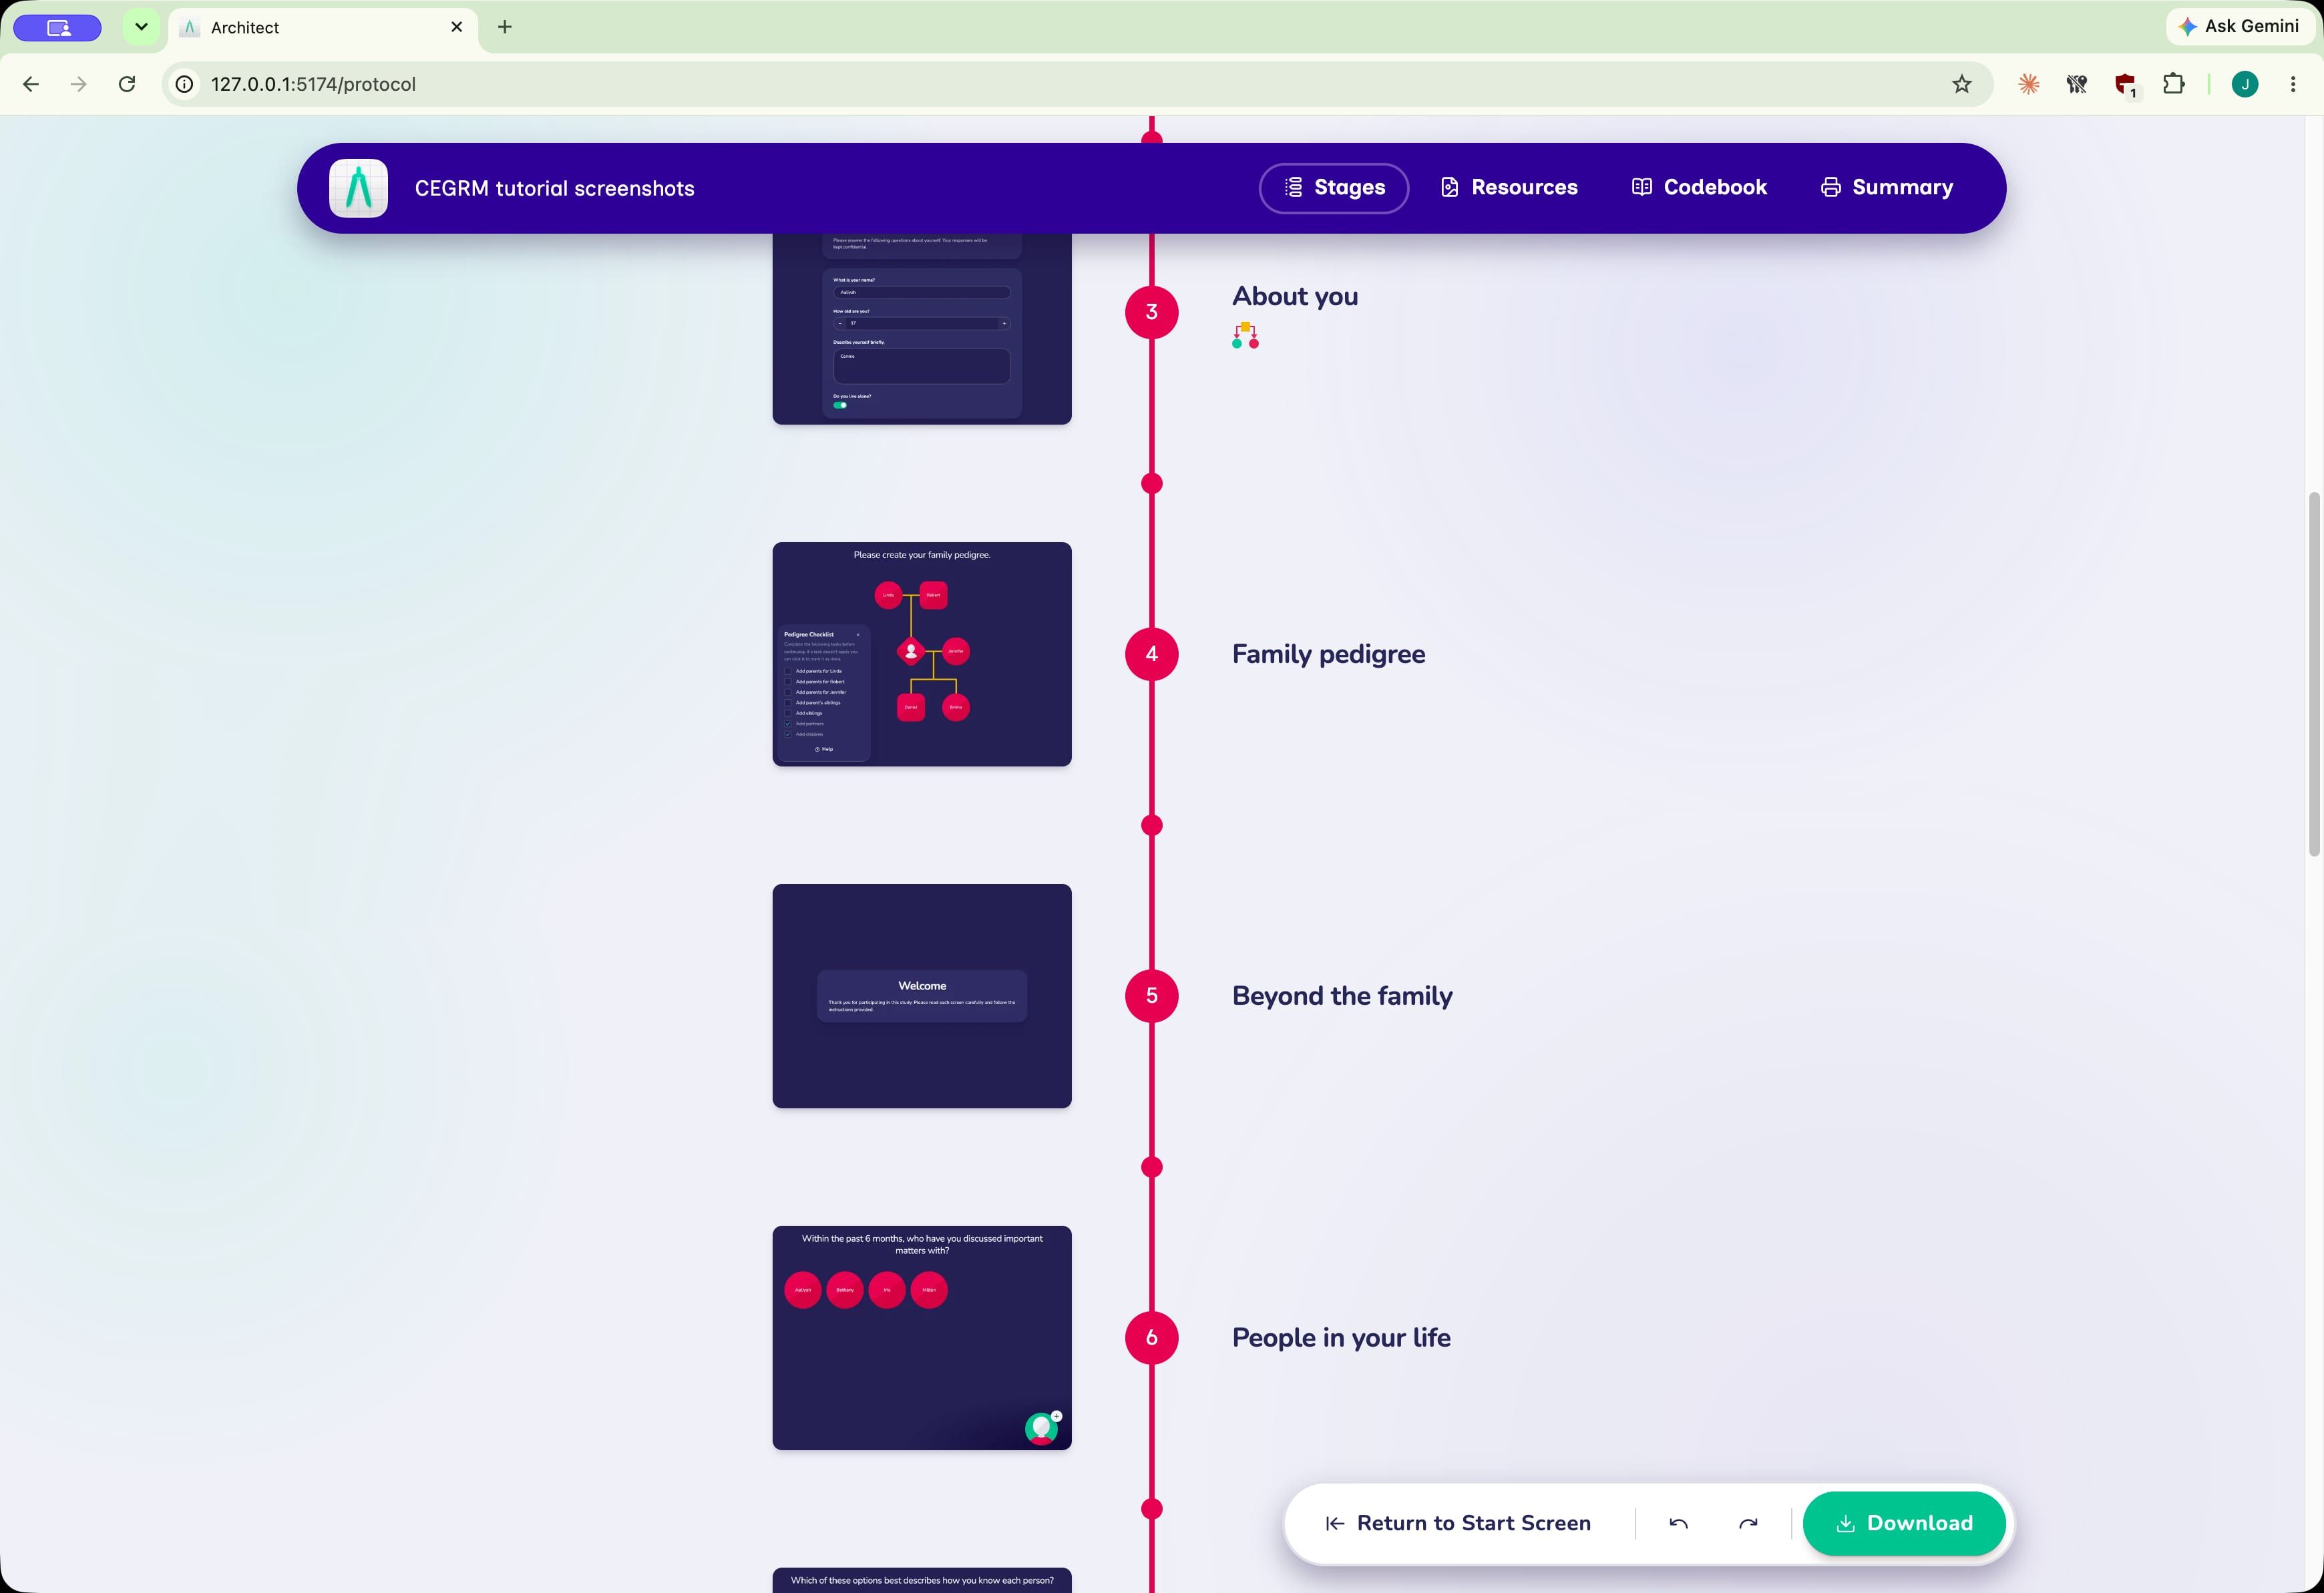
Changing the order can change the meaning of the data. The non-kin relationship stage assumes that pedigree relationships have already been derived. The Narrative stage expects a Sociogram to have established a stable layout. After reordering the protocol, review every stage filter, layout variable, and interviewer instruction. The timeline records these dependencies alongside the presentation order.
Use one person node type for the whole social world
The template defines one node type, person, for the participant, family
members, and non-family contacts. A shared type allows everyone to appear in the
same Sociogram and Narrative.
Separate node types for "family" and "network member" would fragment the
completed CEGRM. A spouse, adoptive parent, cousin who is also a close friend, or
clinician who participates in a family's social world would have to be assigned
to one category or duplicated. The shared person type preserves these
overlapping roles through variables and relationships.
The distinction between family and non-family is stored through variables and relationships:
relationship_to_egois calculated by the Family Pedigree interface for people in the pedigree.tie_typeandtie_type_otherclassify people added beyond the pedigree.is_egoidentifies exactly one node as the participant.biologicalSexsupports pedigree symbols and sex-linked inheritance logic; it is not a measure of gender identity.
The same name variable labels people in the Family Pedigree and the Quick Add
Name Generator. It is configured as required and unique. Pedigree labels
are protocol data and follow the same codebook validation rules as names entered
elsewhere. Create a separate pedigree-name variable only when the analysis
requires two different concepts.
Construct the family pedigree inclusively
The Family Pedigree stage stores family members as person nodes and family
connections as family_relationship edges. Edge variables distinguish
partnerships, biological parentage, adoptive and social parentage, gamete donors,
and gestational carriers. This permits the reproductive pathway needed for
inheritance analysis to coexist with the family relationships that matter
socially.
The template uses participant-choice framing. At the beginning of the task, the participant can choose between gendered parent terms and gamete-based terms. The latter asks about egg and sperm contribution and works without assuming that parental role, gender identity, biological sex, gestation, and genetic contribution are interchangeable. This configuration supports donor conception, surrogacy, adoption, same-sex parents, and other family structures while preserving the information needed by the pedigree data model.
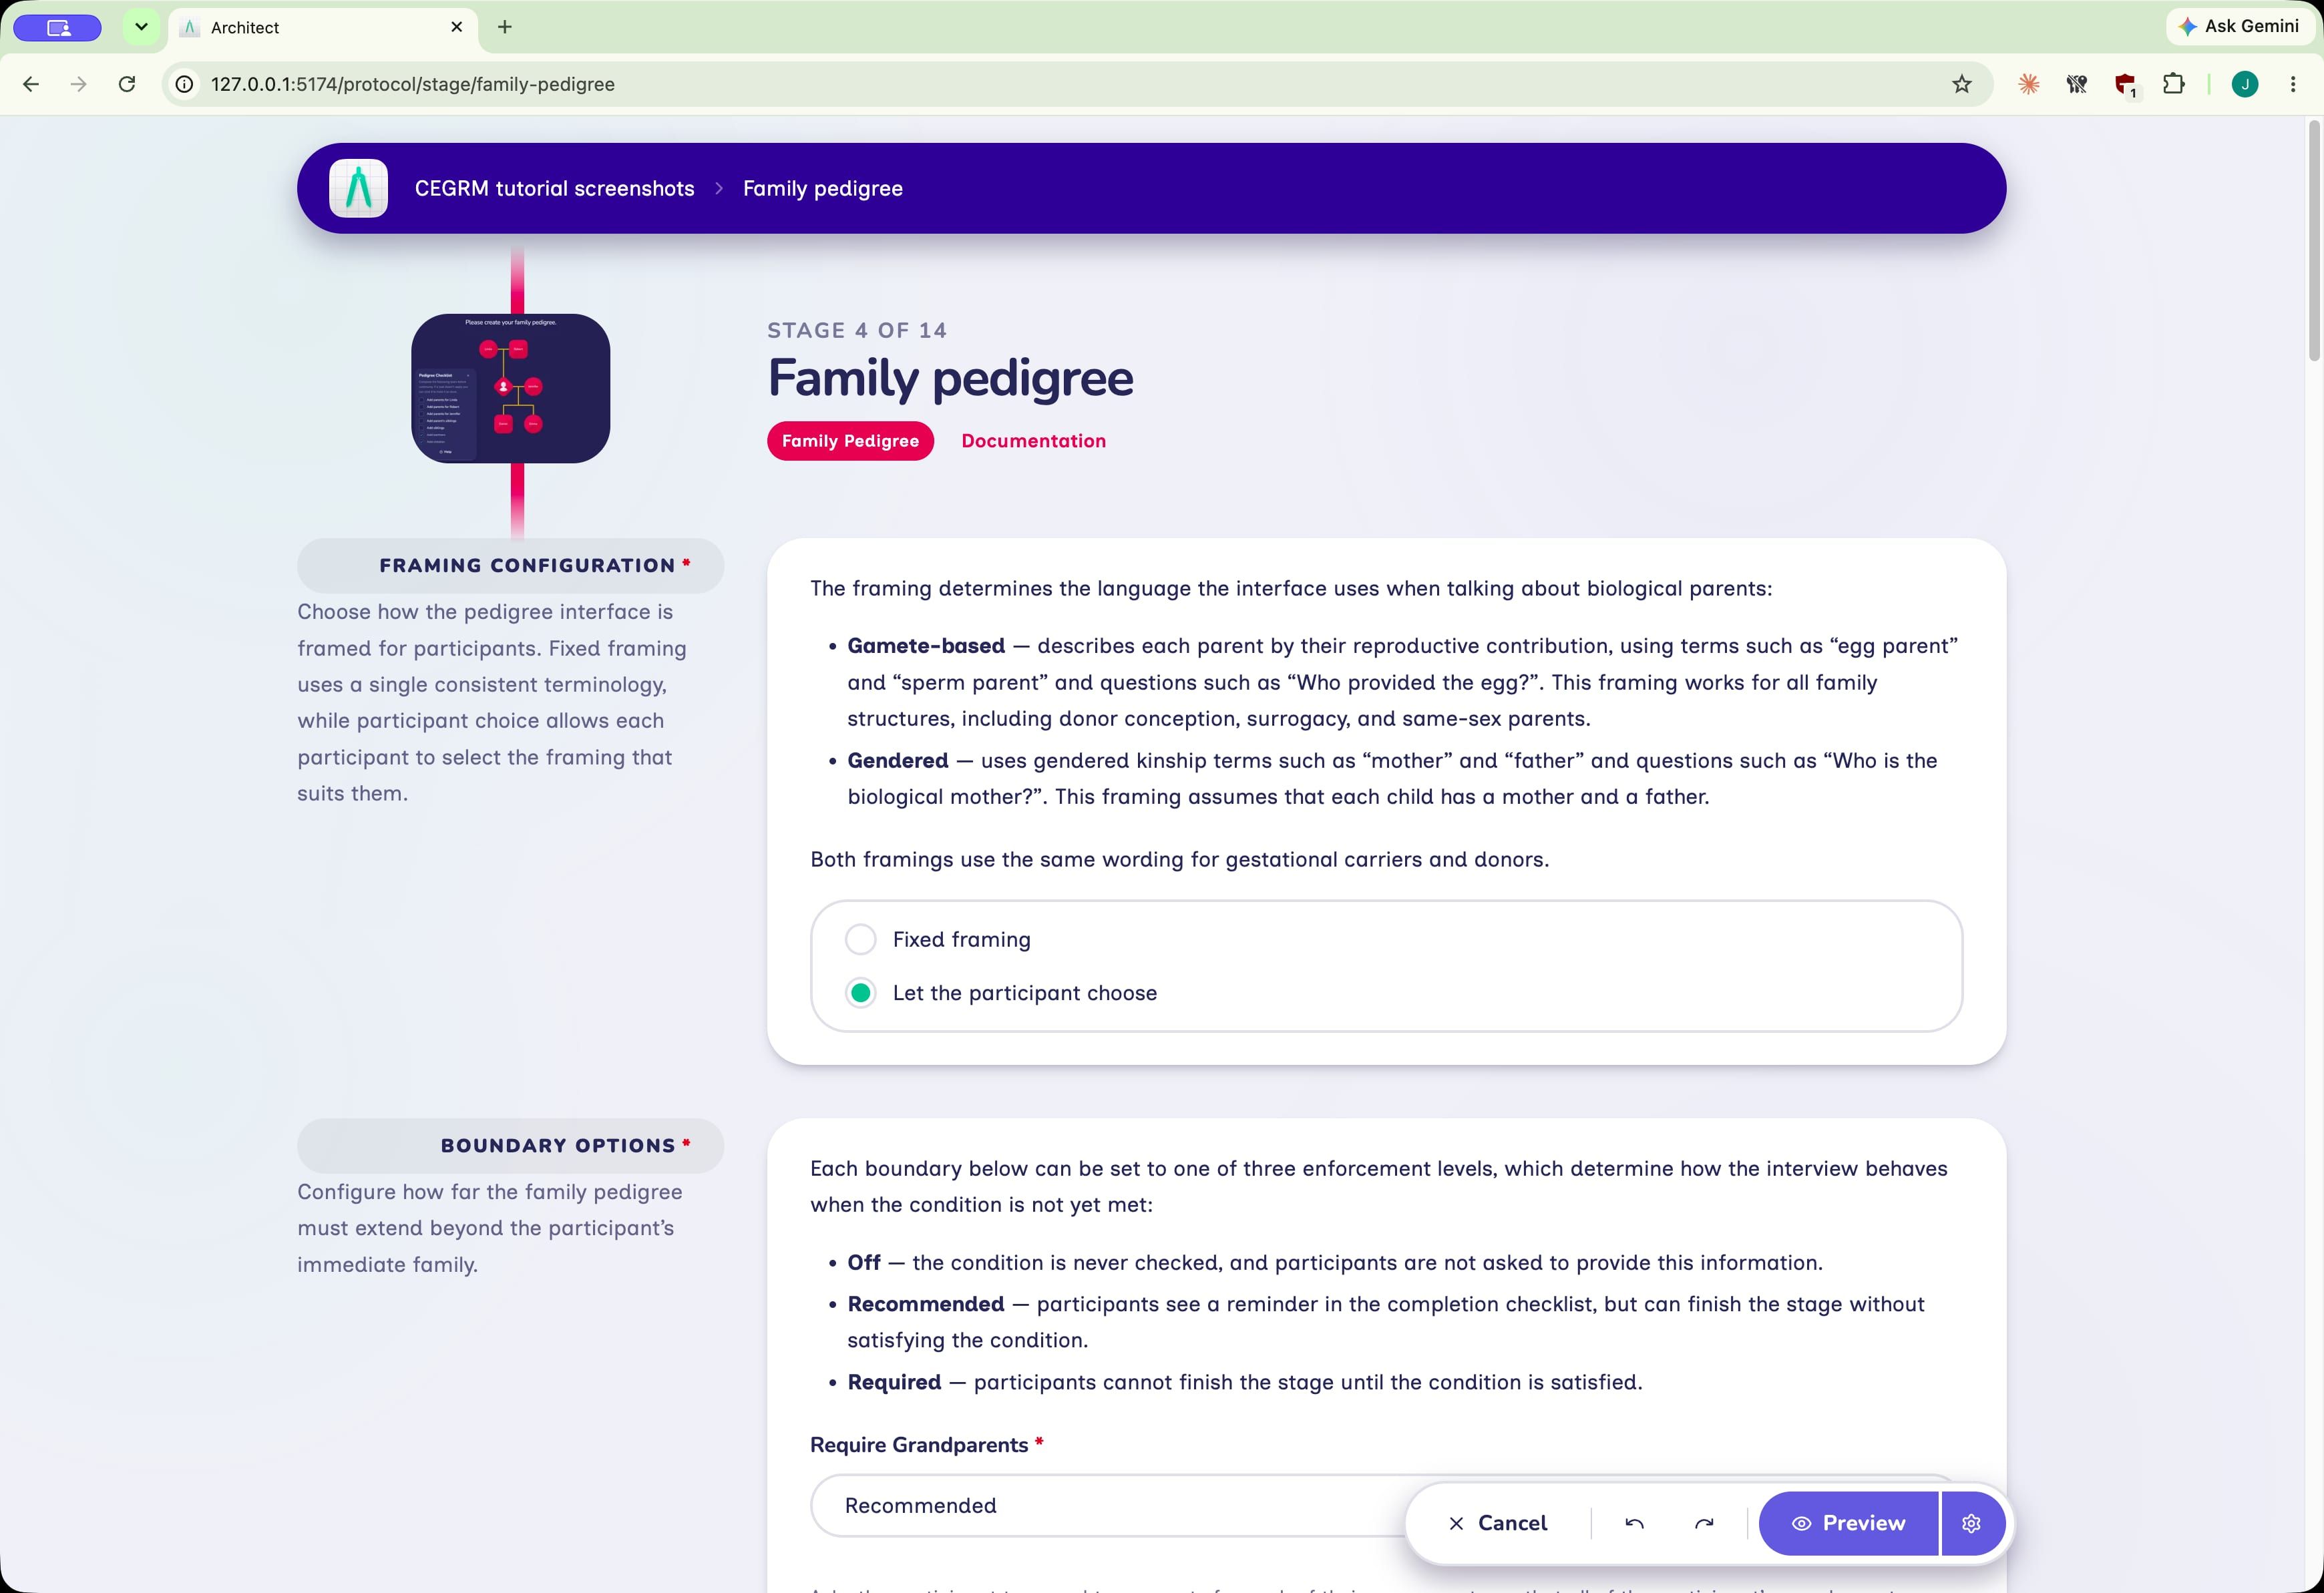
The template marks grandparents and the families of a participant's children's other genetic contributors as recommended. Participants receive a visible reminder, but missing family history does not block completion or invite guessing. Set stricter boundaries only when the sampling frame, condition, and analysis require them and the added interview burden is acceptable.
Two nomination prompts follow construction of the pedigree:
- Who in the family has had the condition.
- Who has had genetic testing for it.
These populate has_condition and had_testing. They record the participant's
report; they do not establish diagnosis, genotype, or verified clinical status.
If verified data are available from another source, preserve the provenance of
both reports rather than silently replacing one with the other.
Decide whether to pre-populate the pedigree
For some clinical studies, an existing pedigree may be available before the CEGRM interview. Pre-population can reduce burden and allow the session to focus on review, correction, social relationships, and interpretation. It also changes the interaction: a participant is responding to a representation prepared by the study rather than building the representation from a blank canvas.
If you pre-populate, document the source and date of the pedigree, distinguish imported facts from participant corrections, and give the participant an explicit opportunity to add social, adoptive, donor, gestational, and other relationships that may be absent from a clinical pedigree.
Expand from kin to the wider personal network
The transition screen tells the participant that friends, colleagues, neighbours, group members, and health professionals will sit alongside family on the same map. The following Quick Add Name Generator uses four prompts:
- Friends who matter most.
- People known through work or study.
- People known through groups, including faith and online communities.
- People involved in the participant's health care.
The prompts define broad recall contexts rather than mutually exclusive classes. The same person may be a friend, colleague, and member of a faith community. The "people already named" panel lets the interviewer select that person again without creating a duplicate node.
The next Categorical Bin asks how the participant knows only the people added
beyond the pedigree. Its filter selects people for whom
relationship_to_ego does not exist. This protects pedigree-derived kinship
from being overwritten by the non-family classification and makes the analytic
distinction explicit: use relationship_to_ego for family and tie_type for
contacts outside the pedigree.
Review this boundary for your study. "Family" is not exhausted by biological kinship, and the Family Pedigree can contain social and adoptive relationships. The template treats people included in the participant's family story as family for later communication-role questions, irrespective of genetic connection.
Add closeness and contact frequency as Network Canvas measures
Closeness and contact frequency are not colored CEGRM symbols from the original instrument. They are deliberate Network Canvas additions that locate the support exchanges in the participant's broader relationship structure.
The closeness stage asks about every person except the participant and uses four ordered categories from "Not close" to "Very close." The contact stage uses a 12-month reference period and six categories from "No contact" to "Daily or almost daily." It excludes people recorded as deceased because current contact frequency would be inapplicable, while retaining people whose living status is unknown.
These measures let an analysis distinguish, for example, a very close tie that provides several forms of support from a less close professional tie that provides important information. They should not be treated as proxies for the support variables themselves. Adapt the wording, period, and response options to your research question, and keep the ordinal measurement level in mind during analysis.
Separate network structure from support domains
The first Sociogram begins by asking which people know one another. It creates
knows edges between network members and displays only that edge type. Pedigree
edges remain in the data but are not drawn on this screen; otherwise the dense
family structure would be mistaken for the social connection being elicited.
The next four prompts implement the colored exchange domains used in the later CEGRM literature:
- Health or genetic information.
- Practical or tangible help.
- Emotional support or sharing feelings.
- Spiritual or religious connection.
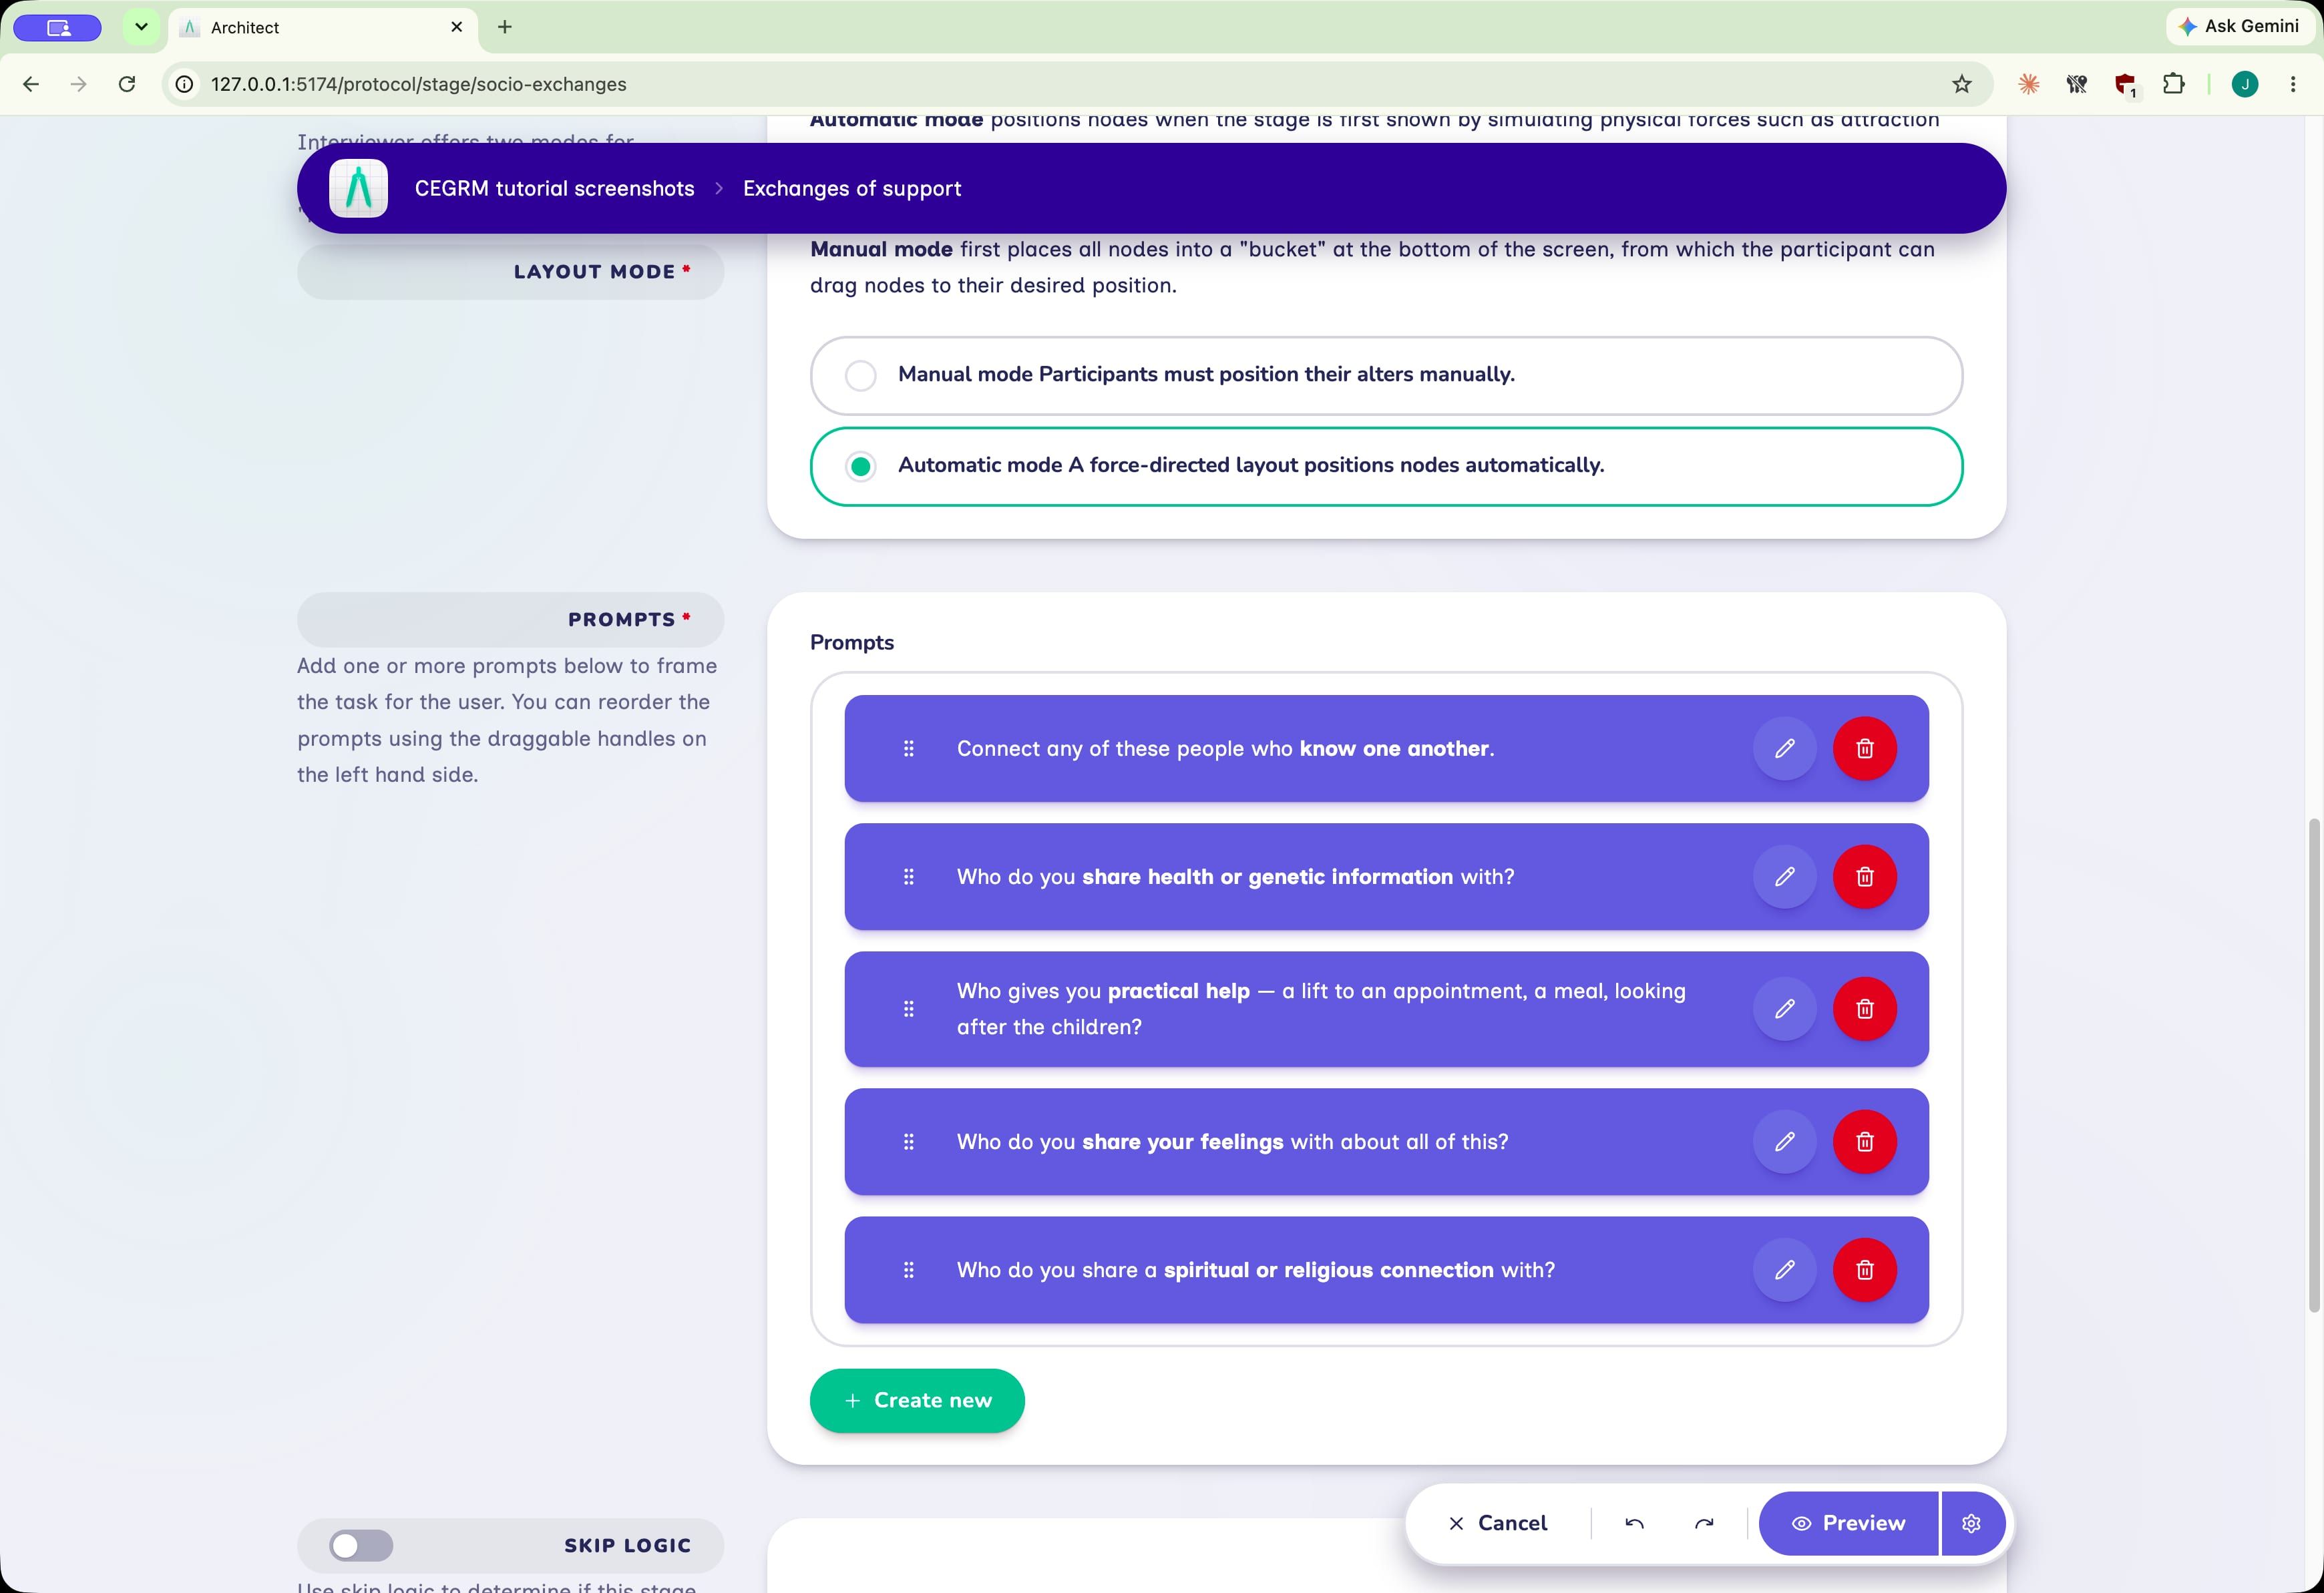
Each support prompt highlights people and writes a boolean node variable:
exch_information, exch_tangible, exch_emotional, or exch_spiritual.
This mirrors the original act of placing a colored symbol beside a person. In
analytic terms it records the participant's report of an ego-to-person support
relationship, not a directed exchange between every pair of people on the map.
This implementation follows the bundled template's ego-to-person nominations. Research questions about giving versus receiving, reciprocity, or support between two network members need directed edge types or edge variables. A boolean node attribute does not encode direction, regardless of the word "exchange" in the prompt.
The Sociogram lays people out automatically during the knows prompt and stores
their positions in the layout variable. The four support prompts reuse those
positions. This stability makes visual comparison possible: a change in color
or highlight has meaning because the map itself has not been rearranged.
Preserve the family communication roles
The second Sociogram asks which family members act as:
- Information gatherers, who look for or keep track of information.
- Information disseminators, who help people talk and pass information on.
- Information blockers, who find the subject difficult to discuss or would rather not know.
These roles follow the evolved CEGRM and the family communication analyses of Koehly et al. (2009). The blocker category requires particular care. Later qualitative work showed that perceived blocking could reflect privacy, protection, fear, cultural traditions, difficult memories, and reciprocal family dynamics rather than a stable deficit in a person (Peters et al., 2011). The template therefore asks who finds the subject hard to talk about, rather than labelling someone as obstructive in participant-facing language.
The stage is filtered to people who have relationship_to_ego, so the roles are
asked about the participant's family system. Widen that filter only if
non-family brokerage is part of the research question. It also disables
automatic layout and reuses the coordinates established by the preceding
all-person Sociogram. Recomputing a layout for the family subset would make its
coordinates incompatible with the non-family contacts when the completed map is
assembled again.
Use the completed map as an elicitation device
The Narrative stage is the interpretive center of the protocol. It presents three presets on a fixed layout:
- Everyone on your map shows the people and
knowsconnections. - Forms of support overlays the four exchange domains.
- Family health communication overlays gatherer, disseminator, and blocker roles.
Move between these views at the participant's pace. Ask what they notice before offering an interpretation. Useful probes include:
- Where do different forms of support cluster?
- Who provides several forms of support, and who provides one specialized form?
- Which support comes mainly from outside the family?
- Who bridges otherwise separate parts of the network?
- Where is support or communication absent?
- Does the map look accurate to the participant, and what does it fail to show?
Free drawing is enabled so the interviewer can annotate the display during the conversation. Those marks are not exported. The spoken narrative and interviewer interpretation are also not automatically part of the network data. If they are research data, add an approved capture process such as audio recording and transcription, structured field notes, or a separate form. State how the material will be linked to the interview without compromising confidentiality.
The following Narrative Pedigree returns to the multi-generational family view
and colors people identified as having the condition. Its inheritance pattern
defaults to unknown, and inferred at-risk statuses are disabled for safety.
Select an inheritance pattern only when the condition supports it. Enable
inferred statuses only when qualified personnel will interpret the display under
an approved disclosure procedure. The visualization is not a diagnosis, and its
inference model cannot represent incomplete penetrance, phenocopies, uncertain
variants, mosaicism, or every clinically relevant complexity.
Plan the quantitative analysis before fieldwork
The template supports several complementary analytic representations:
| Construct | Template data | Typical use |
|---|---|---|
| Family structure | family_relationship edges and their relationship variables | Reconstruct pedigree and social, adoptive, donor, gestational, and partnership relations. |
| Condition and testing | has_condition, had_testing | Describe participant-reported incidence and testing across generations. |
| Personal network composition | relationship_to_ego, tie_type, tie_type_other | Compare kin, non-kin, professional, group, and other sources of support. |
| Relationship context | closeness, contact_frequency | Relate support roles to subjective closeness and interaction frequency. |
| Network structure | knows edges | Calculate size, density, components, brokerage, or other measures justified by the design. |
| Support domains | Four exch_* booleans | Count providers by domain and identify multiplex support ties. |
| Communication roles | role_gatherer, role_disseminator, role_blocker | Describe perceived roles within the family communication system. |
Peters et al. (2016) organized CEGRM support into breadth, types, and depth. In that study, breadth counted friends, confidantes, and social groups; types referred to the four support domains; and depth summed the number of support types attached to a relationship, from zero to four. The template captures named people rather than a separate group entity, so reproduce the published breadth measure only if your elicitation and coding also distinguish confidantes and social groups. A direct template-based analysis can safely derive:
- The number of named people providing any support.
- The number providing each support type.
- The number of support types attached to each person (
0–4). - The proportion of support providers who are family versus non-family.
Name these derived measures precisely rather than treating every count as the published scale. The CEGRM literature is methodologically exploratory, and the template's first-stage note explicitly cautions that these counts are discussion and descriptive tools, not a validated psychometric support instrument.
Treat the data as one participant's account
A CEGRM records the participant's perception of other people and relationships. A nominated blocker has not necessarily described themselves that way; a family member reported as untested may have tested privately; and two participants from the same family may produce different maps. Those differences are not simply measurement error. They may be evidence about information asymmetry, confidentiality, role expectations, or the relational character of health communication.
Do not merge reports from several family members into a single supposedly true network without an explicit rule for handling disagreement and provenance. If you collect from multiple members of a family, retain respondent identifiers on every nomination and relationship report. The longitudinal and multi-informant CEGRM work demonstrates the analytic value of comparing perspectives rather than erasing them (Peters et al., 2011).
Adapt the template before deployment
Before deployment, settle the following design decisions.
Name the condition and define each construct
Replace every occurrence of "this condition" with language understood by the
study population. Decide whether has_condition means participant report,
clinical diagnosis, a specific phenotype, or something else, and carry that
definition into interviewer training and analysis documentation.
Review all support domains
The original model emphasized information, services, and emotions; later work added spiritual or religious exchange (Peters et al., 2006). Retain the spiritual domain when it is theoretically relevant, but adapt its wording so it does not presume religious belief. Add or remove domains only with a clear account of how the revised instrument relates to prior CEGRM studies.
Set the network boundary
The template elicits important friends, work or study contacts, group members, and health professionals. Decide whether that boundary matches the phenomenon you intend to explain. Specify the reference period, whether deceased people belong in the social map, how groups will be represented, and whether a maximum number of contacts is methodologically defensible.
Decide what a knows edge means
"Know one another" is intentionally broad. If your analysis requires contact, communication, support, or awareness of the condition between network members, ask that construct directly and name the edge accordingly. Edge density is determined by the question, not by the visual appearance of the finished map.
Configure inheritance conservatively
Select autosomalDominant, autosomalRecessive, xLinkedDominant,
xLinkedRecessive, or another supported pattern only when it is appropriate to
the condition and study purpose. Decide whether the participant should ever see
an inferred risk status. If the answer is yes, establish clinical review,
uncertainty language, disclosure procedures, and a response plan before enabling
the feature.
Replace consent, debriefing, and referral text
The template names illness, testing, bereavement, and difficult family communication. Your approved materials should address the collection of third-party information, what is and is not shared with named people, how a participant can pause or stop, how distress will be handled, and what happens if the interview raises a clinical concern. Genetic and family network data can be highly identifying even when first names are replaced with nicknames; configure storage, access, export, and retention accordingly.
Pilot the interview as a visual method
Protocol validation establishes that the file satisfies Network Canvas's data model. It does not establish that participants interpret a prompt as intended, that the interview boundary produces the right network, or that the resulting conversation is ethically and methodologically workable.
Pilot the full sequence with members of the intended population and with every role that will administer it. Observe:
- Whether participants understand why genetic and social relationships are both being collected.
- Whether the pedigree framing fits varied family structures.
- Whether the name generators reach important non-kin without excessive burden.
- Whether support and communication-role questions are distinguishable.
- Whether the stable layout helps comparison or becomes visually crowded.
- Which prompts produce distress, hesitation, or a need for clarification.
- How long pedigree construction, network expansion, and narrative interpretation each take.
- Whether the exported data can reproduce every planned measure without relying on information that exists only in the interviewer's memory.
The pilot should examine the interaction around the map as closely as the exported network. CEGRM research treats that interaction as consequential. Network Canvas likewise uses participant-aided visual elicitation, with software choices that enable and constrain what can be reported (Birkett et al., 2021).
References
- Birkett M, Melville J, Janulis P, Phillips G II, Contractor N, Hogan B. Network Canvas: Key decisions in the design of an interviewer-assisted network data collection software suite. Social Networks. 2021;66:114–124.
- Janulis P, Phillips G, Melville J, et al. Network Canvas: an open-source tool for capturing social and contact network data. International Journal of Epidemiology. 2023;52(4):1286–1291.
- Kenen R, Peters J. The Colored, Eco-Genetic Relationship Map (CEGRM): a conceptual approach and tool for genetic counseling research. Journal of Genetic Counseling. 2001;10(4):289–309.
- Peters JA, Kenen R, Giusti R, Loud J, Weissman N, Greene MH. Exploratory study of the feasibility and utility of the Colored Eco-Genetic Relationship Map (CEGRM) in women at high genetic risk of developing breast cancer. American Journal of Medical Genetics Part A. 2004;130A(3):258–264.
- Peters JA, Hoskins L, Prindiville S, Kenen R, Greene MH. Evolution of the Colored Eco-Genetic Relationship Map (CEGRM) for assessing social functioning in women in hereditary breast-ovarian families. Journal of Genetic Counseling. 2006;15(6):477–489.
- Koehly LM, Peters JA, Kenen R, et al. Characteristics of health information gatherers, disseminators, and blockers within families at risk of hereditary cancer. American Journal of Public Health. 2009;99(12):2203–2209.
- Peters JA, Kenen R, Hoskins LM, et al. Unpacking the blockers: understanding perceptions and social constraints of health communication in hereditary breast ovarian cancer susceptibility families. Journal of Genetic Counseling. 2011;20(5):450–464.
- Peters JA, Kenen R, Bremer R, Givens S, Savage SA, Mai PL. Easing the burden: describing the role of social, emotional and spiritual support in research families with Li-Fraumeni syndrome. Journal of Genetic Counseling. 2016;25(3):529–542.